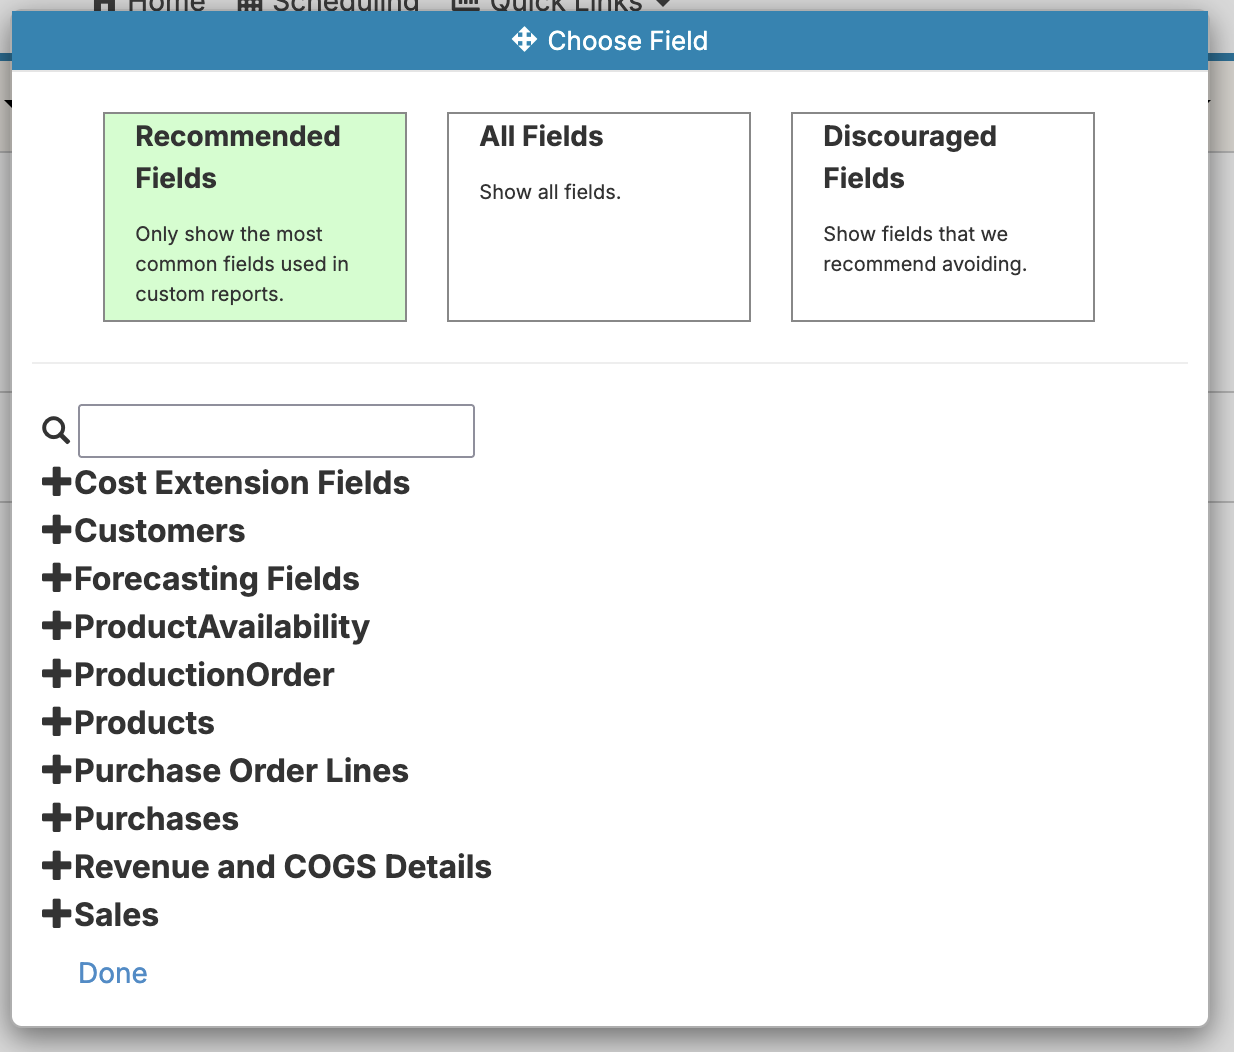
Easy Insight Logo
Call 1-(720)-316-8174

Report Basics

  • Report Basics -- learn the basic concepts around building reports in Easy Insight
  • Conditional Formatting -- learn how to apply colors to certain cells, chart bars, and more based on the data in the report
  • Customize Joins -- learn how to customize the way that data is joined between different tables within your data source
  • Field Editor -- learn how to edit the settings on a specific field such as formatting and aggregation
  • Field Documentation -- learn how to add inline documentation per field within your reports
  • Goals -- learn how to add goals to your reports
  • Version History -- learn how to roll back to previous versions of a report
  • Linking Reports -- learn how to set up drillthroughs into detail reports and links out to external URLs
  • Date Comparison Reports -- learn how to set up reports going across different date fields
  • Styling Reports -- learn how to customize your report look and feel
  • Custom Fields -- learn how to add custom calculations to your reports
  • Exporting reports -- learn how to export your reports into Excel, PDF, and more
  • Limits -- learn how to limit the number of results shown on your reports
  • Addon Reports -- learn how to reference custom fields from one report from another

Once you have created a data source, you can start building custom reports on it. From the Home page, choose the data source you want to build a report on. Click on the "Create" button and choose "Create Report" from the dropdown. This action will pull up the report editor screen.

Report Editor Intro

Once in the report editor, you can start building your report by clicking on the "Choose Field" button. You'll be prompted to choose the field you want to add from the list of fields on your data source. There are three basic types of fields you can add to your reports:

  • Grouping - grouping fields are text types such as Project Name, Customer, and Responsible Party.
  • Measure - measure fields are numeric, measurable quantities such as Revenue or Count.
  • Date - date fields such as Order Date or Due Date..

As you add fields to the report, it'll automatically retrieve data and render the report for you with each field as a new column. You can drag columns around to reorder the fields or click on column headers to sort the data. In the example below, Current Stage is a Grouping, while Deal Size is a Measure which has been summed up for each value of Current Stage.

Report Editor Intro

In the section labeled as Report Fields, you can click on the report fields to pop up a dropdown with a variety of field specific options. Edit the Field Properties allows you to rename the field, change aggregation on measures, add drillthroughs, and much more.

Report Editor Intro

Once you're happy with your report, click on the highlighted orange Save button in the upper left corner of the screen. Give the report a name and click Save. Click on the Back to Reports button (far left) to return to the report list.

Report Editor Intro

Once back on the report list, you'll find your newly saved report under the Main View section. You can click on the Edit link next to the report name to jump back into the report editor and make further changes to the report. Clicking on the report name instead of the edit link will take you to the End User view. This view provides a simplified display of the report designed for your viewers. You can click on the Edit Report link in the upper right corner to jump back into the report editor.

Report Editor Intro

You can change the report into a different format than List from the editor by clicking on the List button next to the Report Type label. This will open a window showing your available report types:

Report Editor Intro

For example, try selecting Column as the new format. The example below shows you the result of that selection--one Grouping is used for the X Axis columns going across the bottom of the chart, while the sum of each stage's Deal Size values are shown as the Y Axis of the chart:

Report Editor Intro
Twitter Logo