Easy Insight Logo
Call 1-(720)-316-8174

Concepts

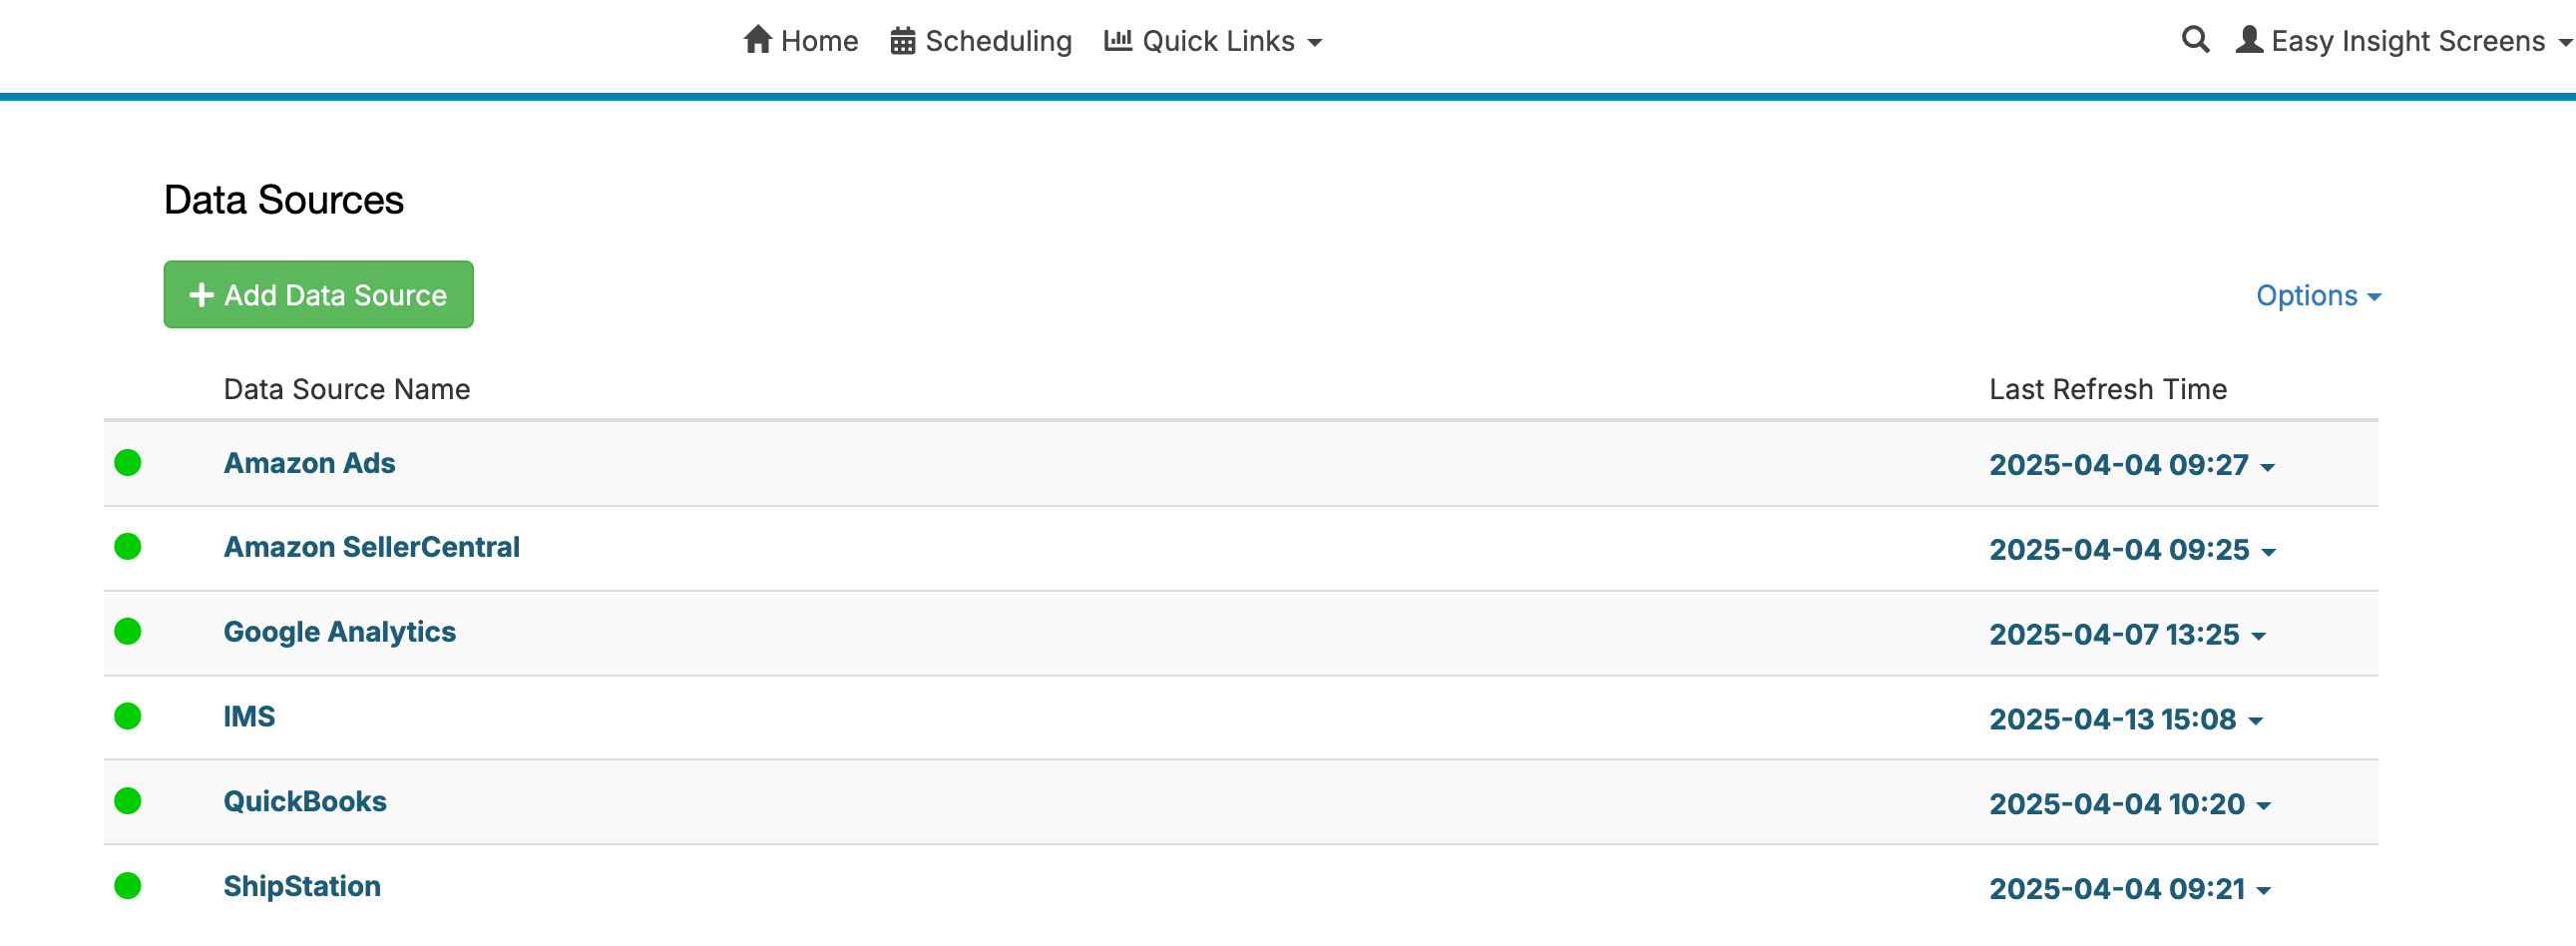
Here's the home page for your Easy Insight account, showing the list of data in your account:

Scheduling View
Connections:

To begin using Easy Insight, click on the 'Add Data Source' button from your Home screen. You'll see the list of connections available to you in Easy Insight. These connections include:

These connections include:

  • Inventory Management/ERP Systems
  • E-Commerce Systems
  • Accounting/Finance Systems
  • CRM Systems
  • Project Management Systems
  • Customer Support Systems
  • Spreadsheet Data (Excel, CSV, Google Sheets, Airtable)
  • Databases (MySQL, SQL Server, Postgres)
  • API Pushing Data into Easy Insight

To get started with a connection, click on the connection icon. Depending on the specific system, you'll be prompted to click and authorize access from the connected system, enter some sort of credentials such as an API token, or upload a file.

Data Sources:

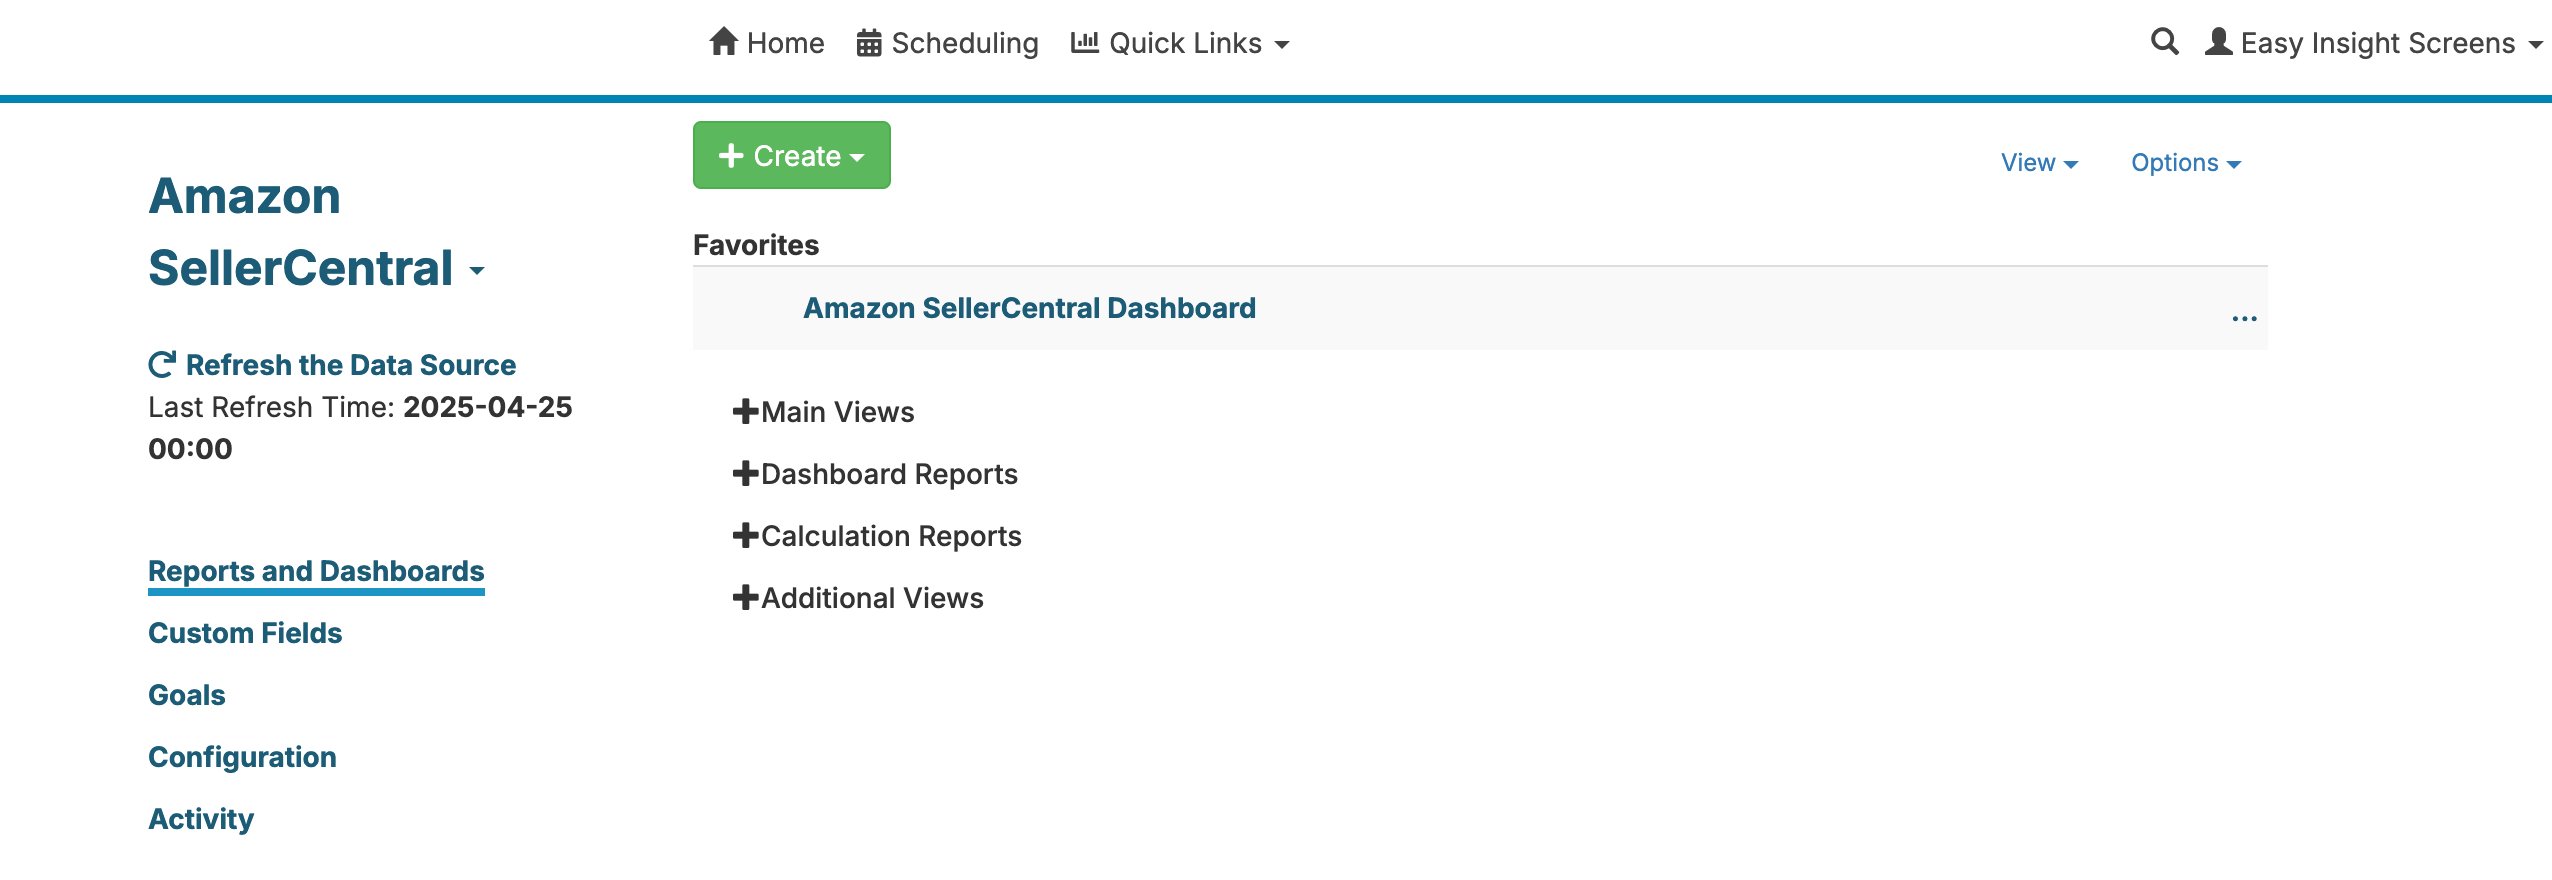
Once a connection is made, a data source is created. Your data source will show in the table on the Home page. By clicking on the name of a data source, you'll go to the data source screen:

Scheduling View

From the data source screen, you can navigate into any reports or dashboards available to you on this data source. The 'Favorites' section contains your favorited reports and dashboards, usually defaulting to a single dashboard with a new connection. You can click on the three dots to the right of a report or dashboard name to favorite the report or dashboard.

Reports:

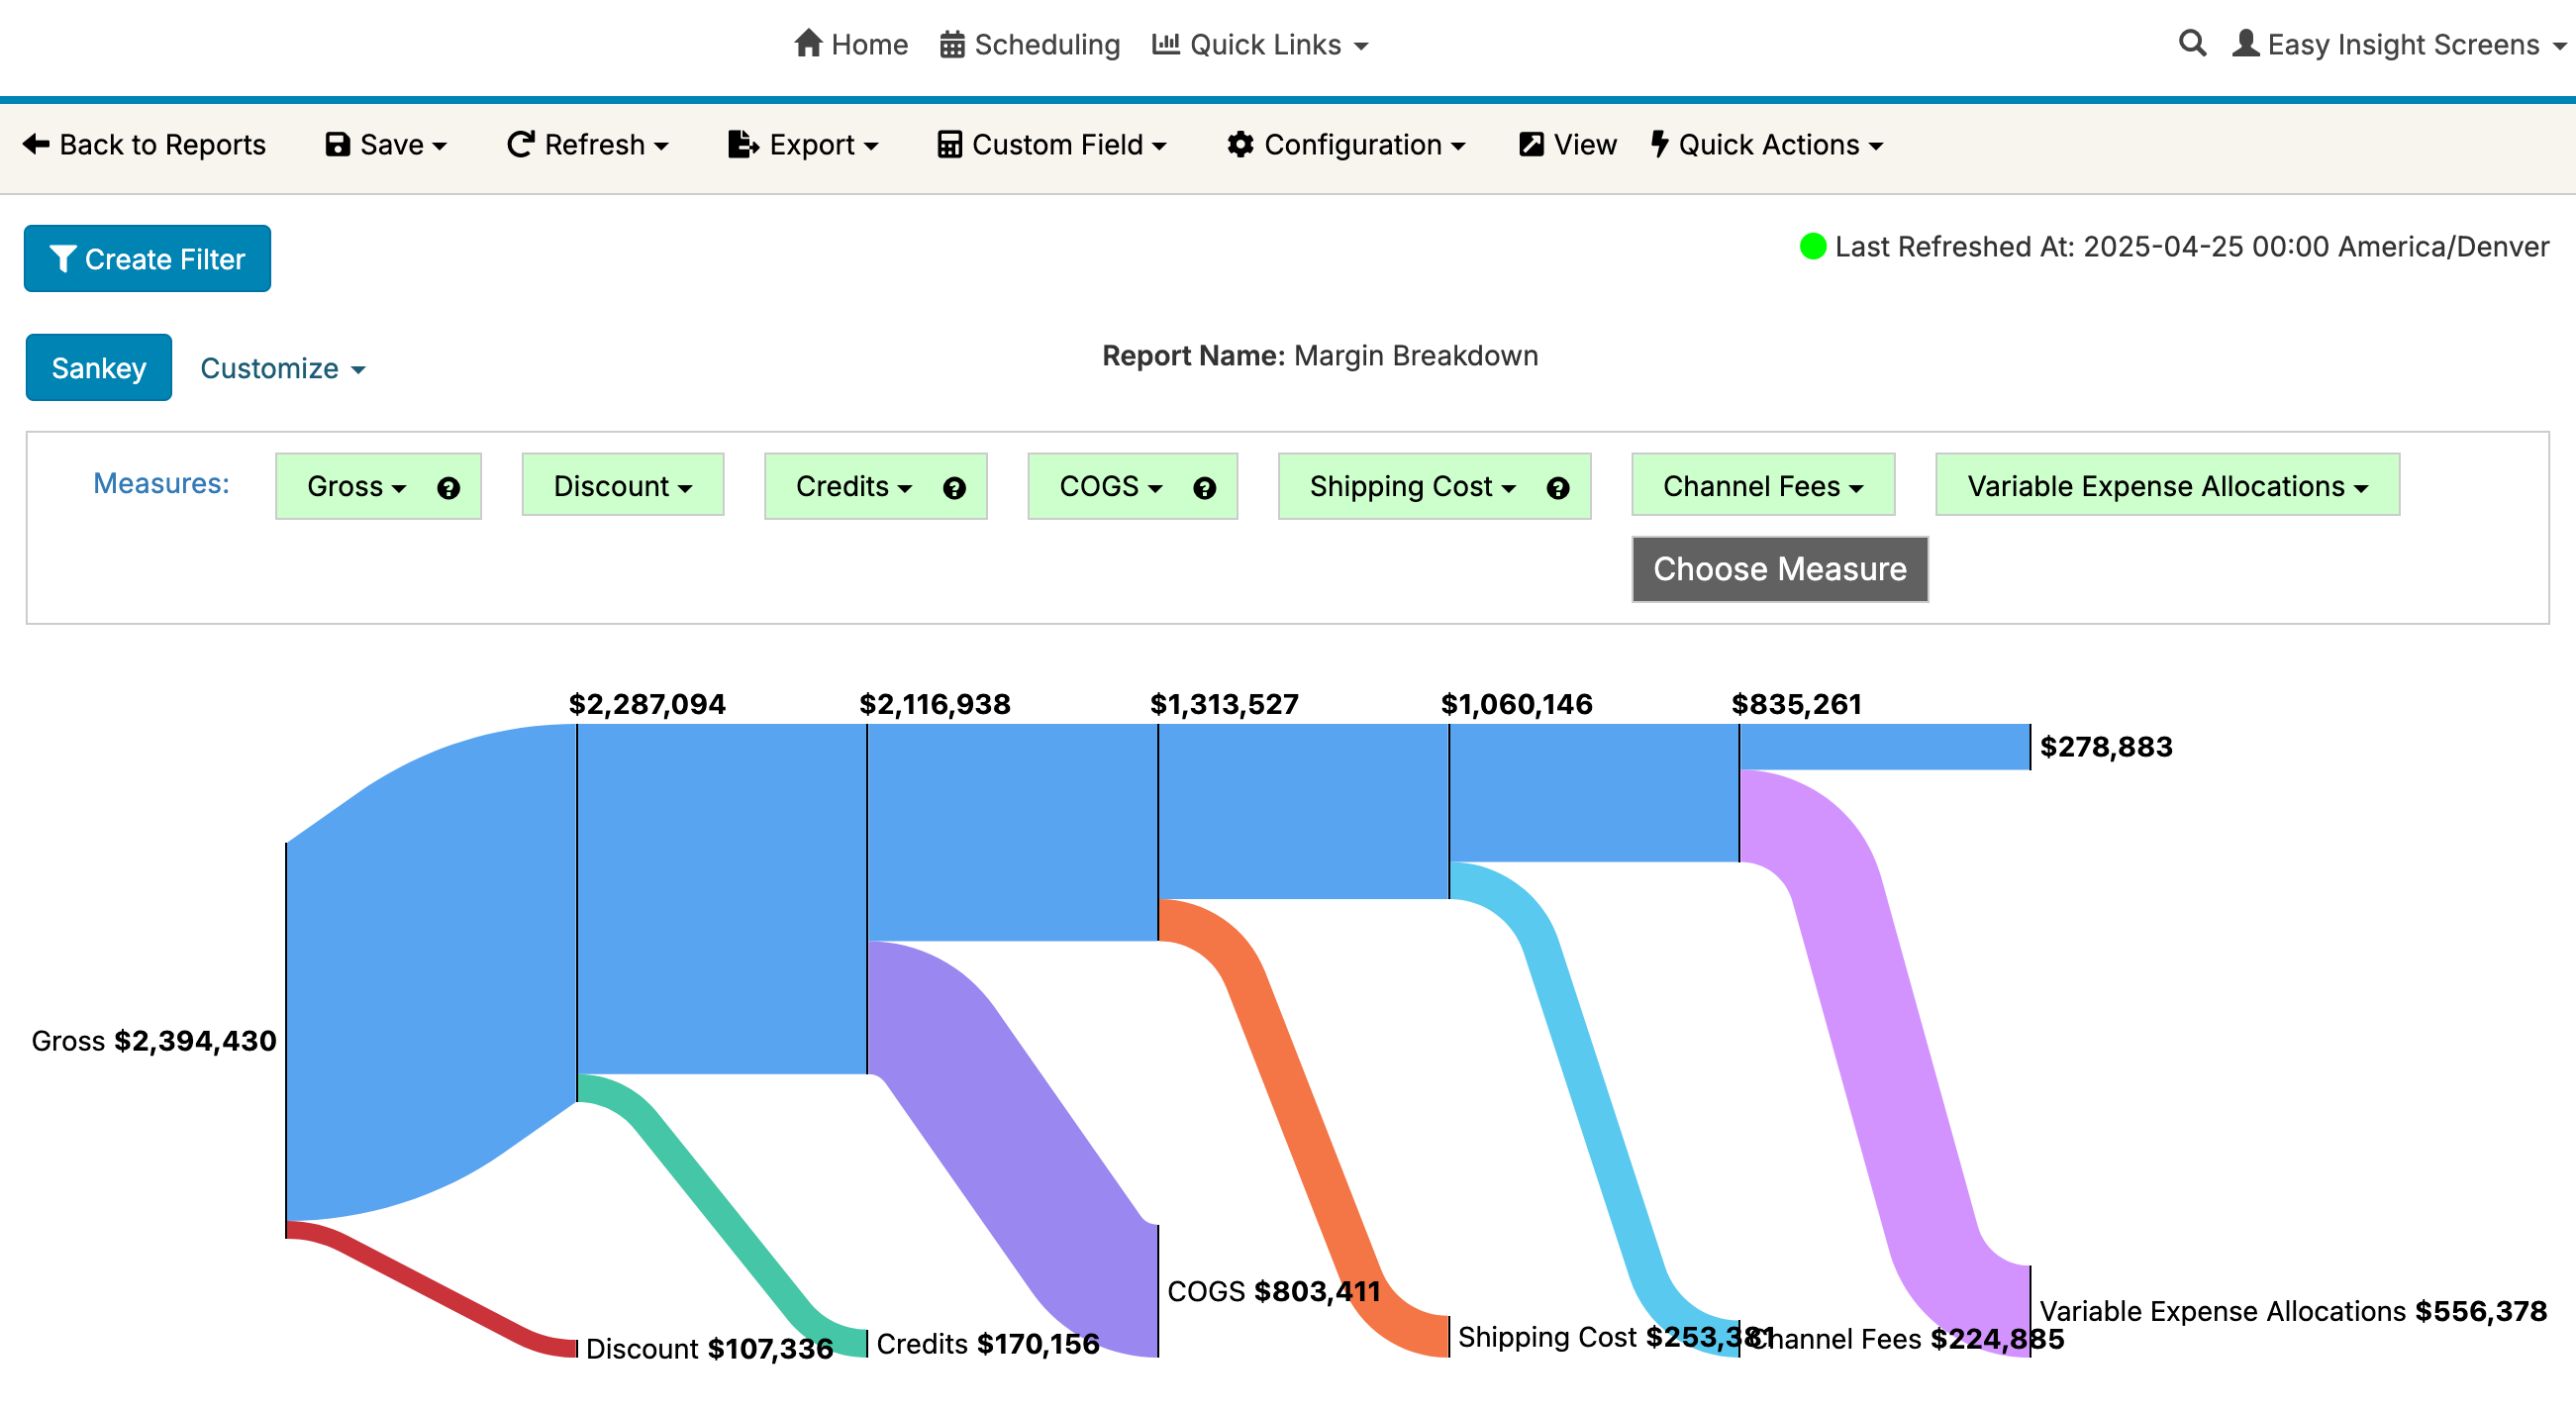
Reports are the core of Easy Insight. A report can be a table, a chart, a map, a pivot table, a tree, or other possible visualizations, containing different fields and filters. You can build your own reports by clicking on the 'Create' button and choosing 'Create Report'. This action will take you to the report editor:

Scheduling View

For more information on building reports, see Creating Reports.

Dashboards:

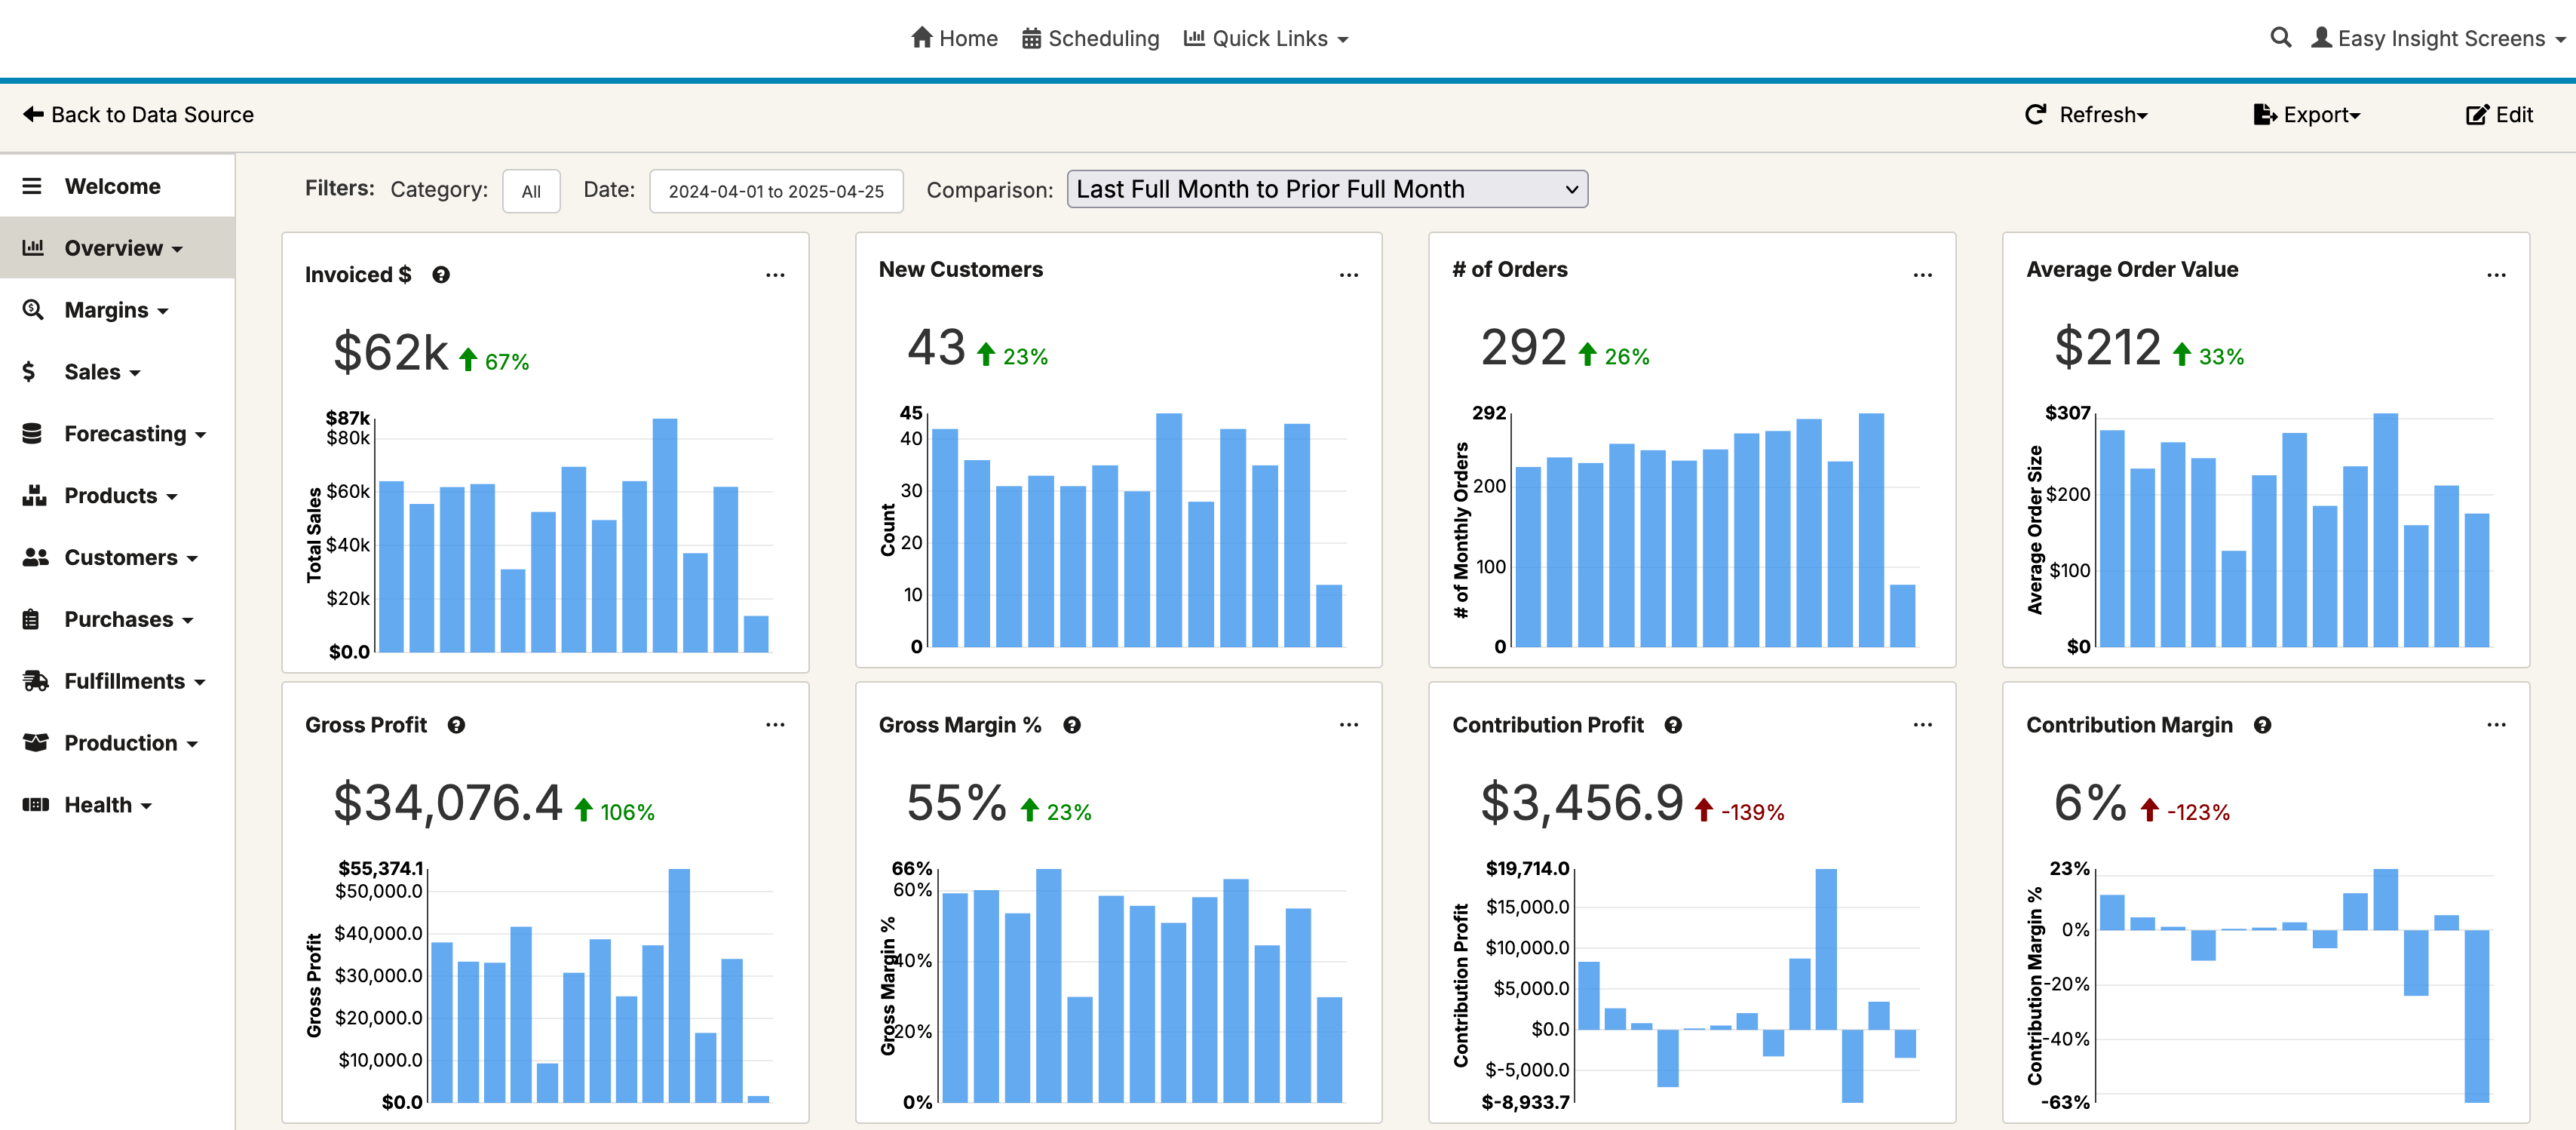
A dashboard is a screen that combines multiple reports into one or more pages:

Scheduling View

You can build your own dashboards by clicking on the 'Create' button and choosing 'Create Dashboard'. This action will take you to the dashboard editor. For more information on building dashboards, see Getting Started with Dashboards.

Fields:

As you use the report editor, you'll build your reports from fields exposed by the data source. There are three main types of fields in Easy Insight:

  • Groupings are text data such as Invoice Number, Customer, or Product Name/li>
  • Measures are numeric data such as Total Sales, Quantity Sold, Task Count, or Number of Tickets
  • Dates are dates like Order Date, Task Completion Date, or Ticket Resolved At
Filters:

You'll use Filters in your reports to pare down the results in your report to the particular subset of data you want to see. Examples of using Filters include:

  • Only show a fixed set of five patricular project names
  • Only show tickets created in the last full month
  • Only show deals with greater than ten associated activities
  • Only show todo items where the name of the todo contains "Sample"

To learn more about filters in Easy Insight, take a look at Getting Started with Filters.

Users

There are two main types of users in Easy Insight:

  • Designers are users who can build and modify reports and dashboards
  • Viewers are users who can log in, look at and adjust filters on reports and dashboards, but can't make any structural changes or their own reports and dashboards

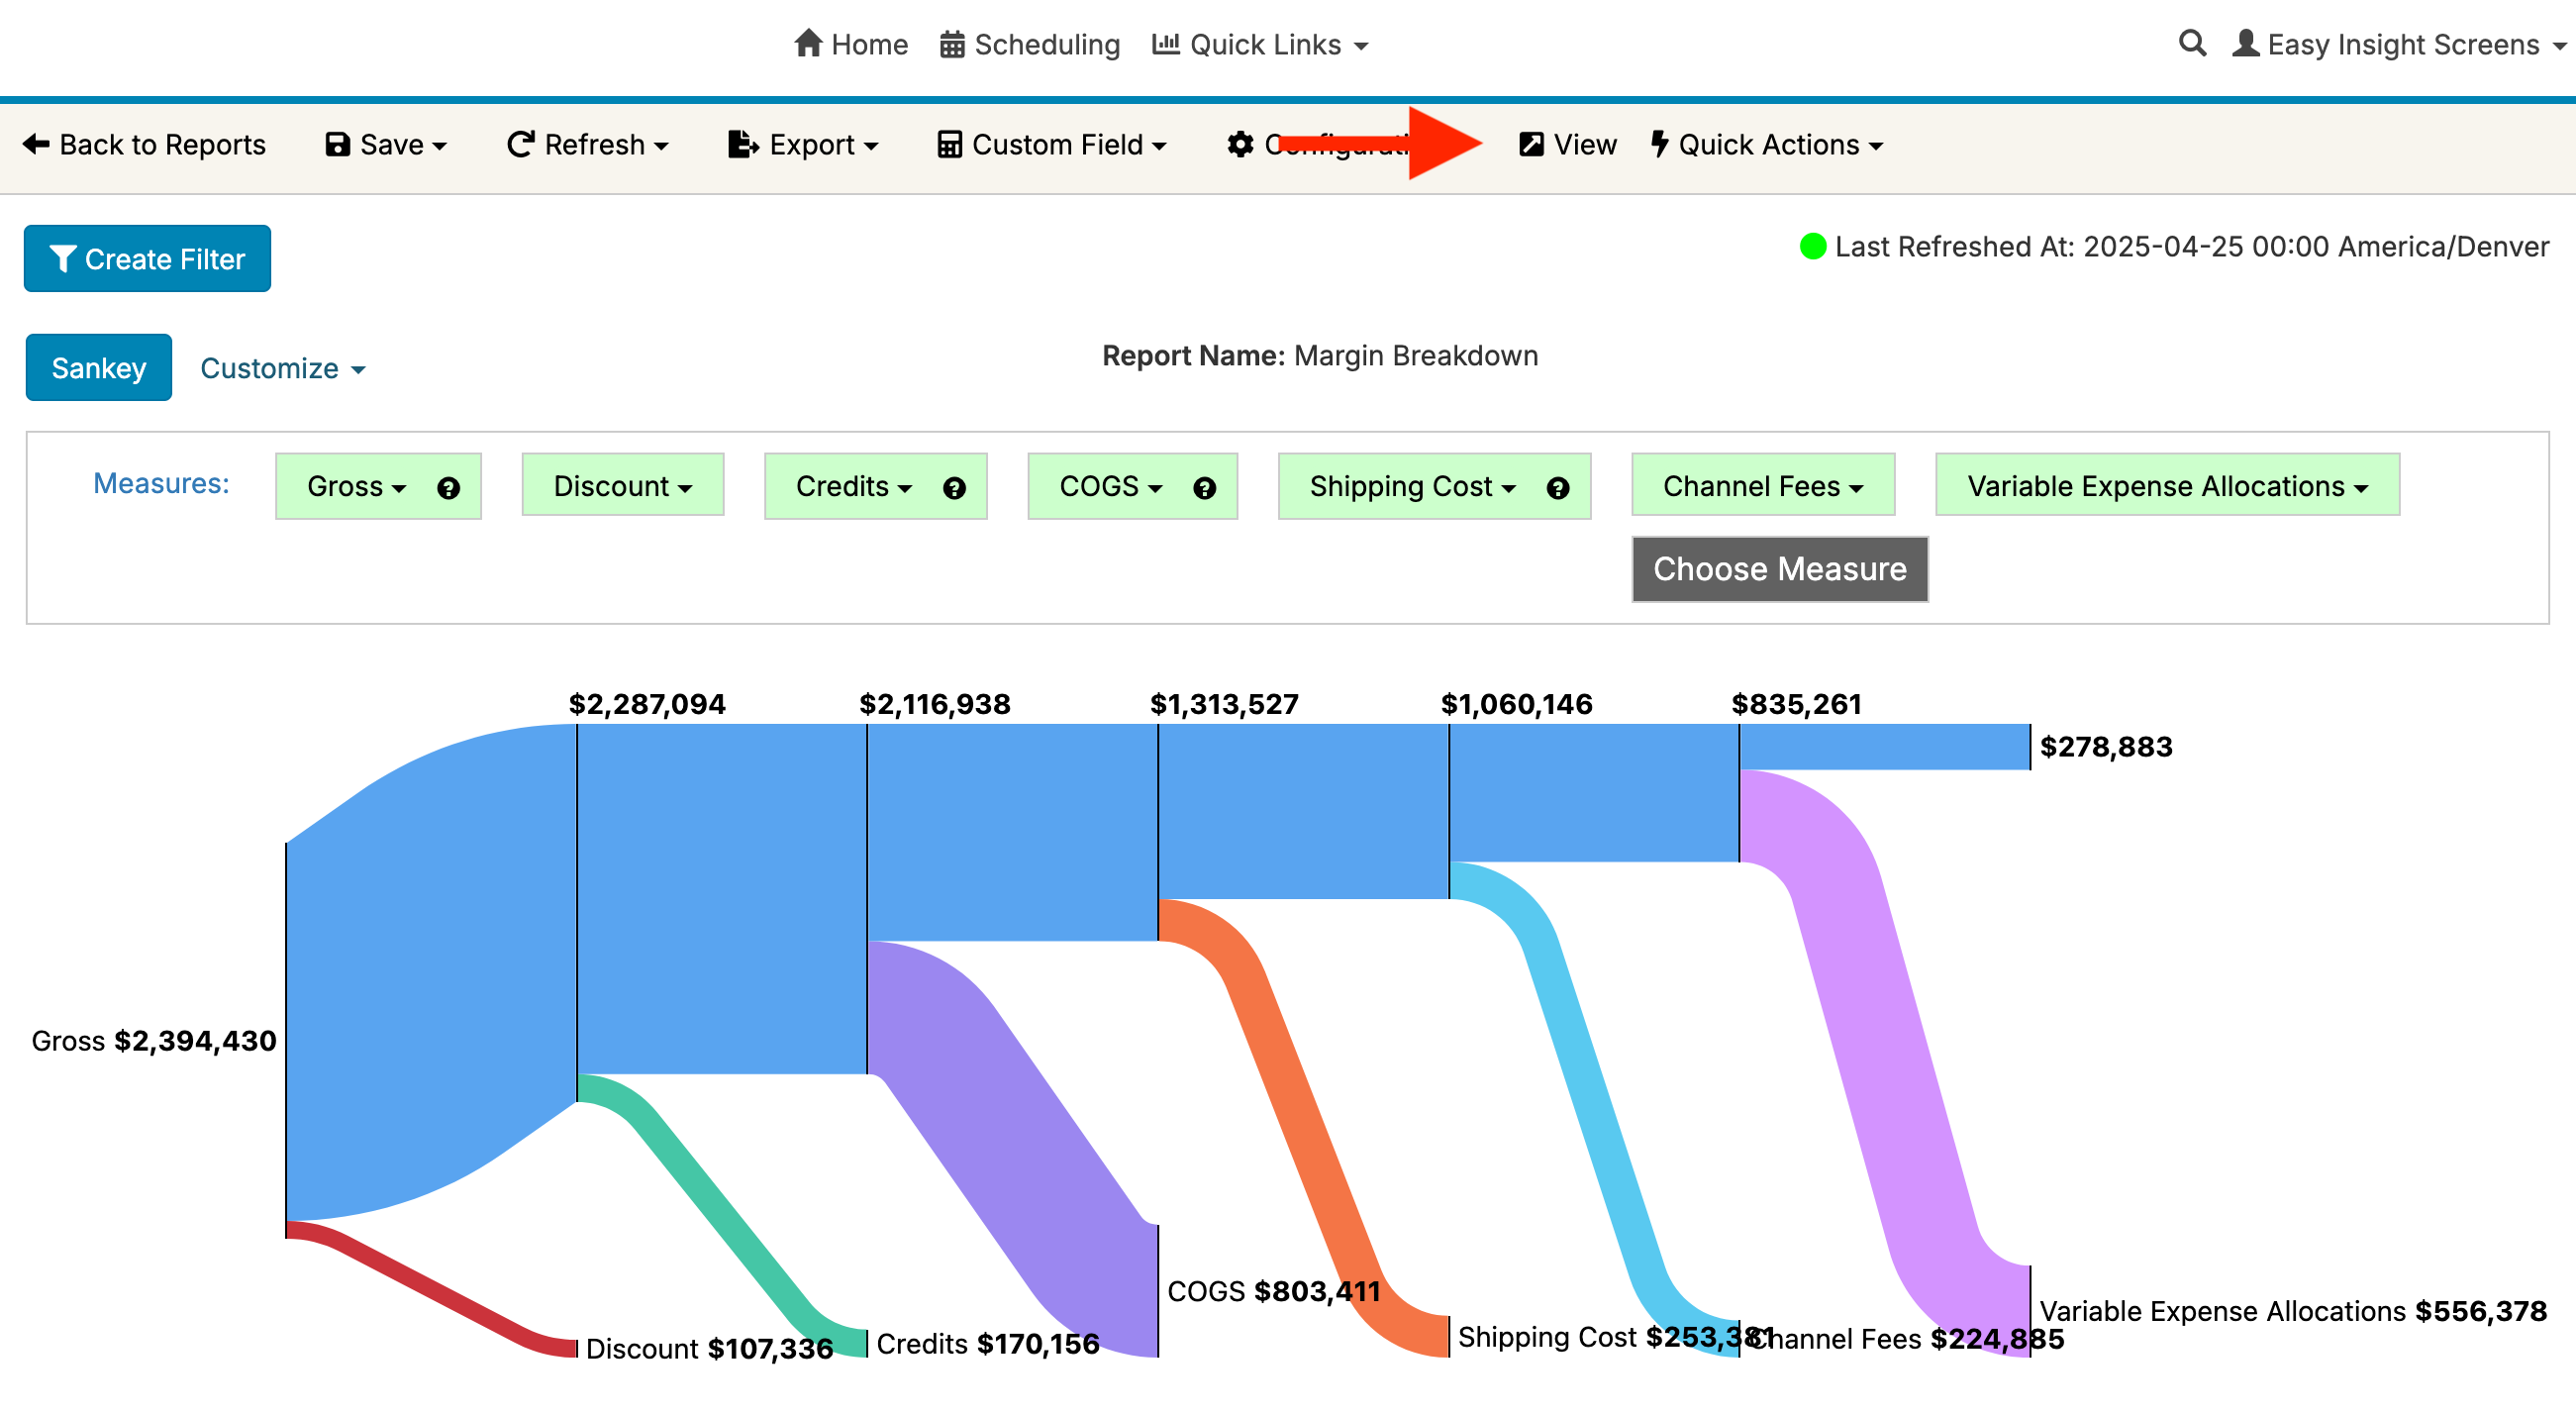
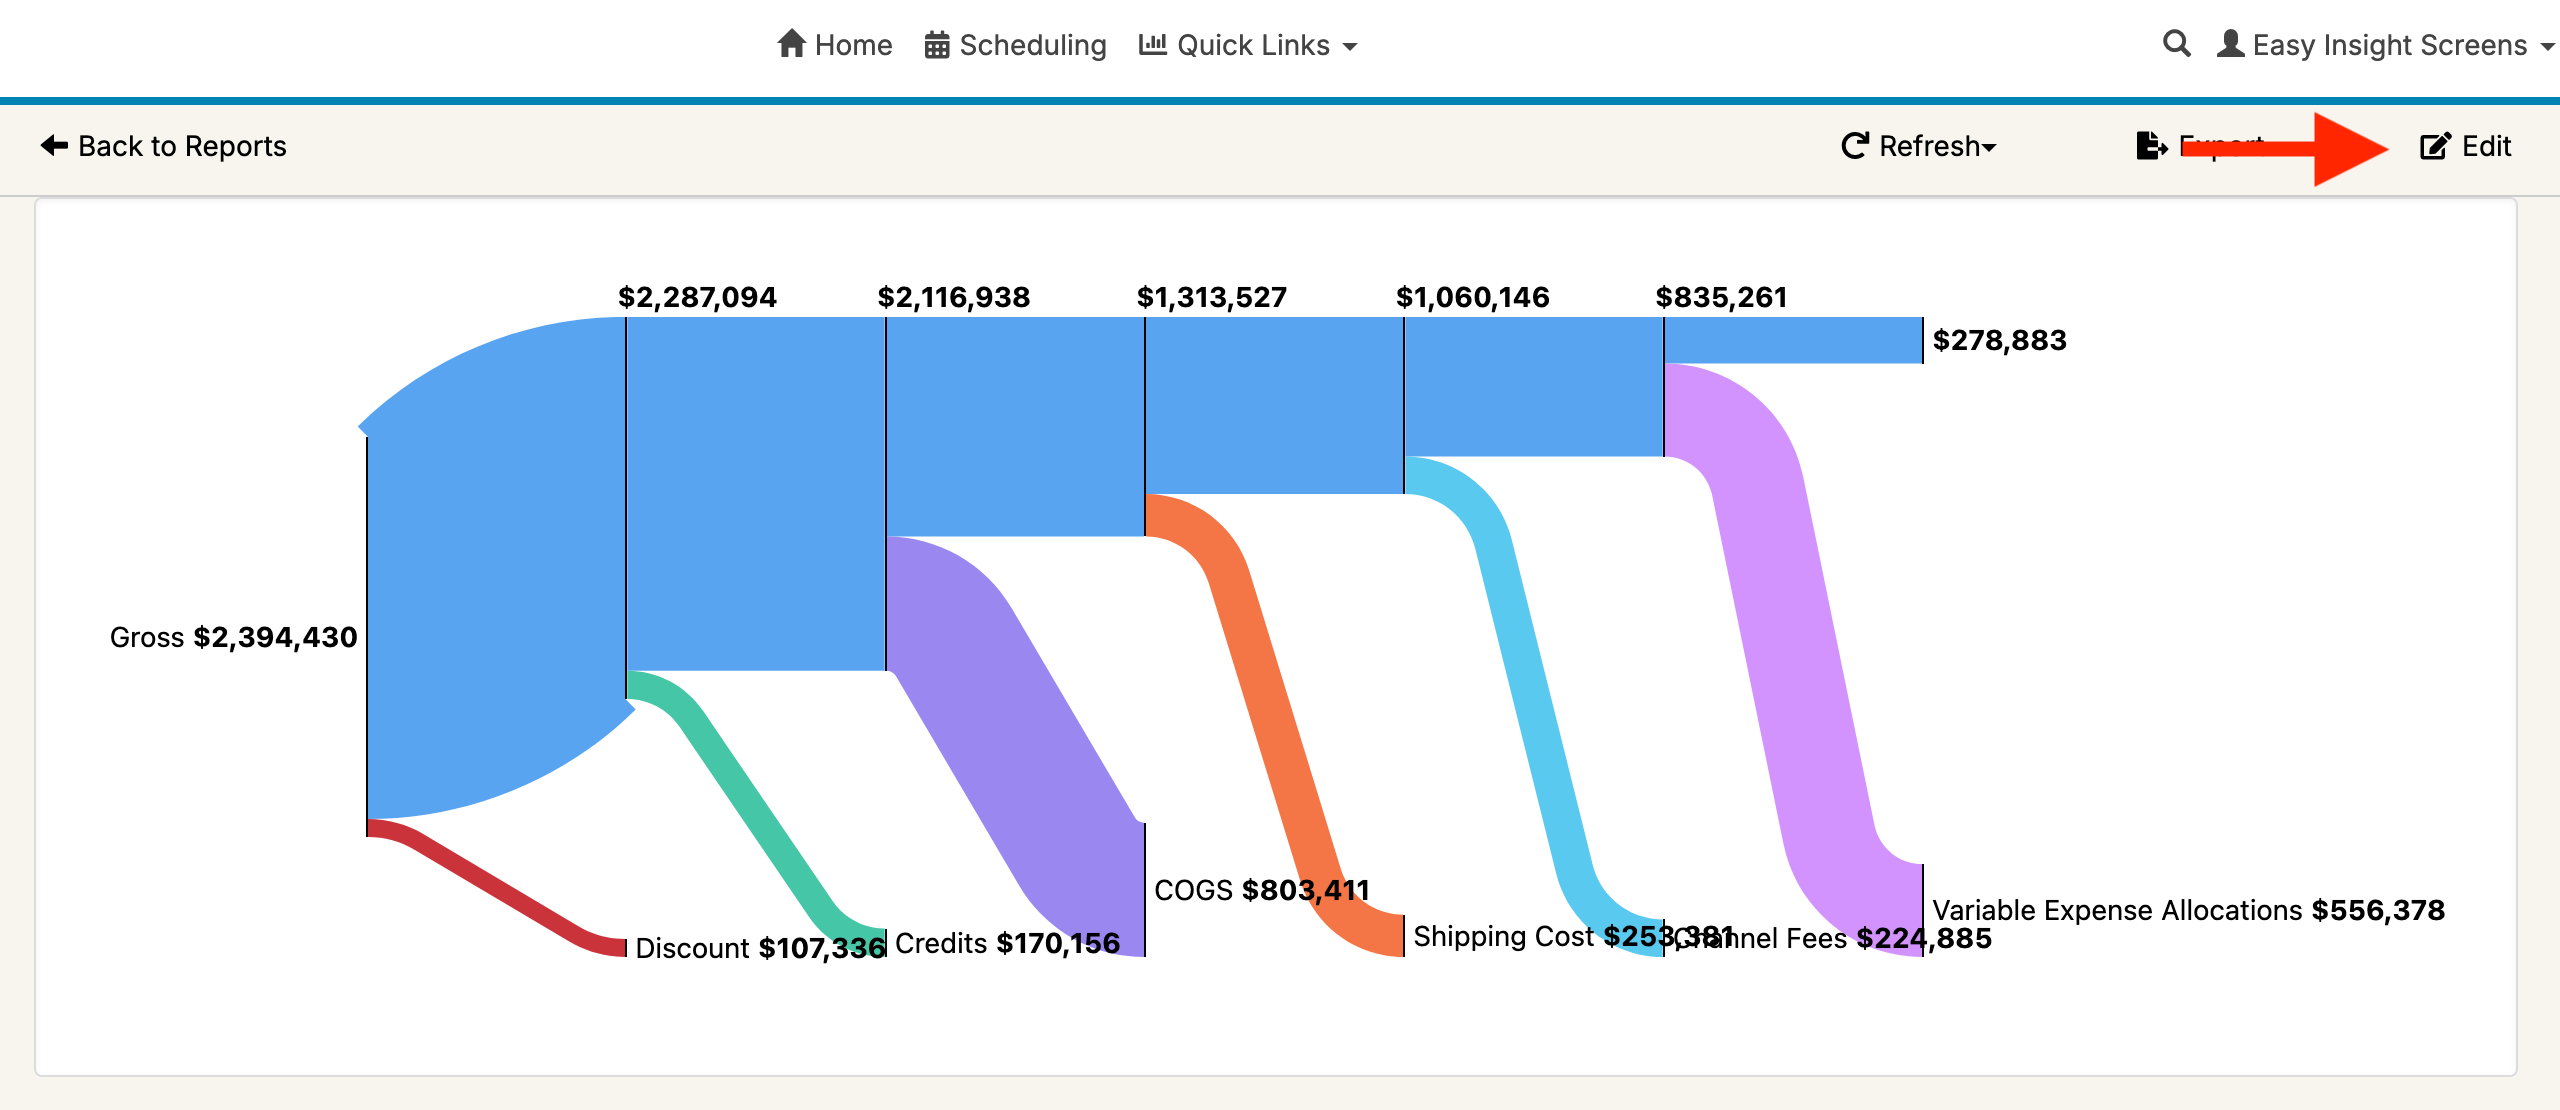
To go along with that difference in roles, there are two distinct screens for reports and dashboards. The Editor screen is where you can choose the report visualization, configure fields, add filters, and so on, while the View is the display that your Viewers will see:

Scheduling View
Scheduling View

The arrows in the images above show how you as a designer can toggle between the two screens. Viewers won't be able to toggle and will just see the View version. For more information about users in Easy Insight, see Users.

Twitter Logo