Easy Insight Logo
Call 1-(720)-316-8174

Dashboards

  • Dashboard Basics -- learn the basic concepts around dashboards in Easy Insight
  • Dashboard and Report Filters -- learn how dashboard and report filters interact, and how to make that interaction
  • Dashboard Distribution -- learn how to easily share dashboards across your users
  • Dashboard Layouts -- learn how to set up a different page layouts on your dashboards
  • Dashboard Styling -- learn how to style the look and feel of your dashboards
  • Embedding Dashboard -- learn how to embed your dashboards into external systems
  • Repeaters -- learn how to repeatedly display variants of the same report on a dashboard
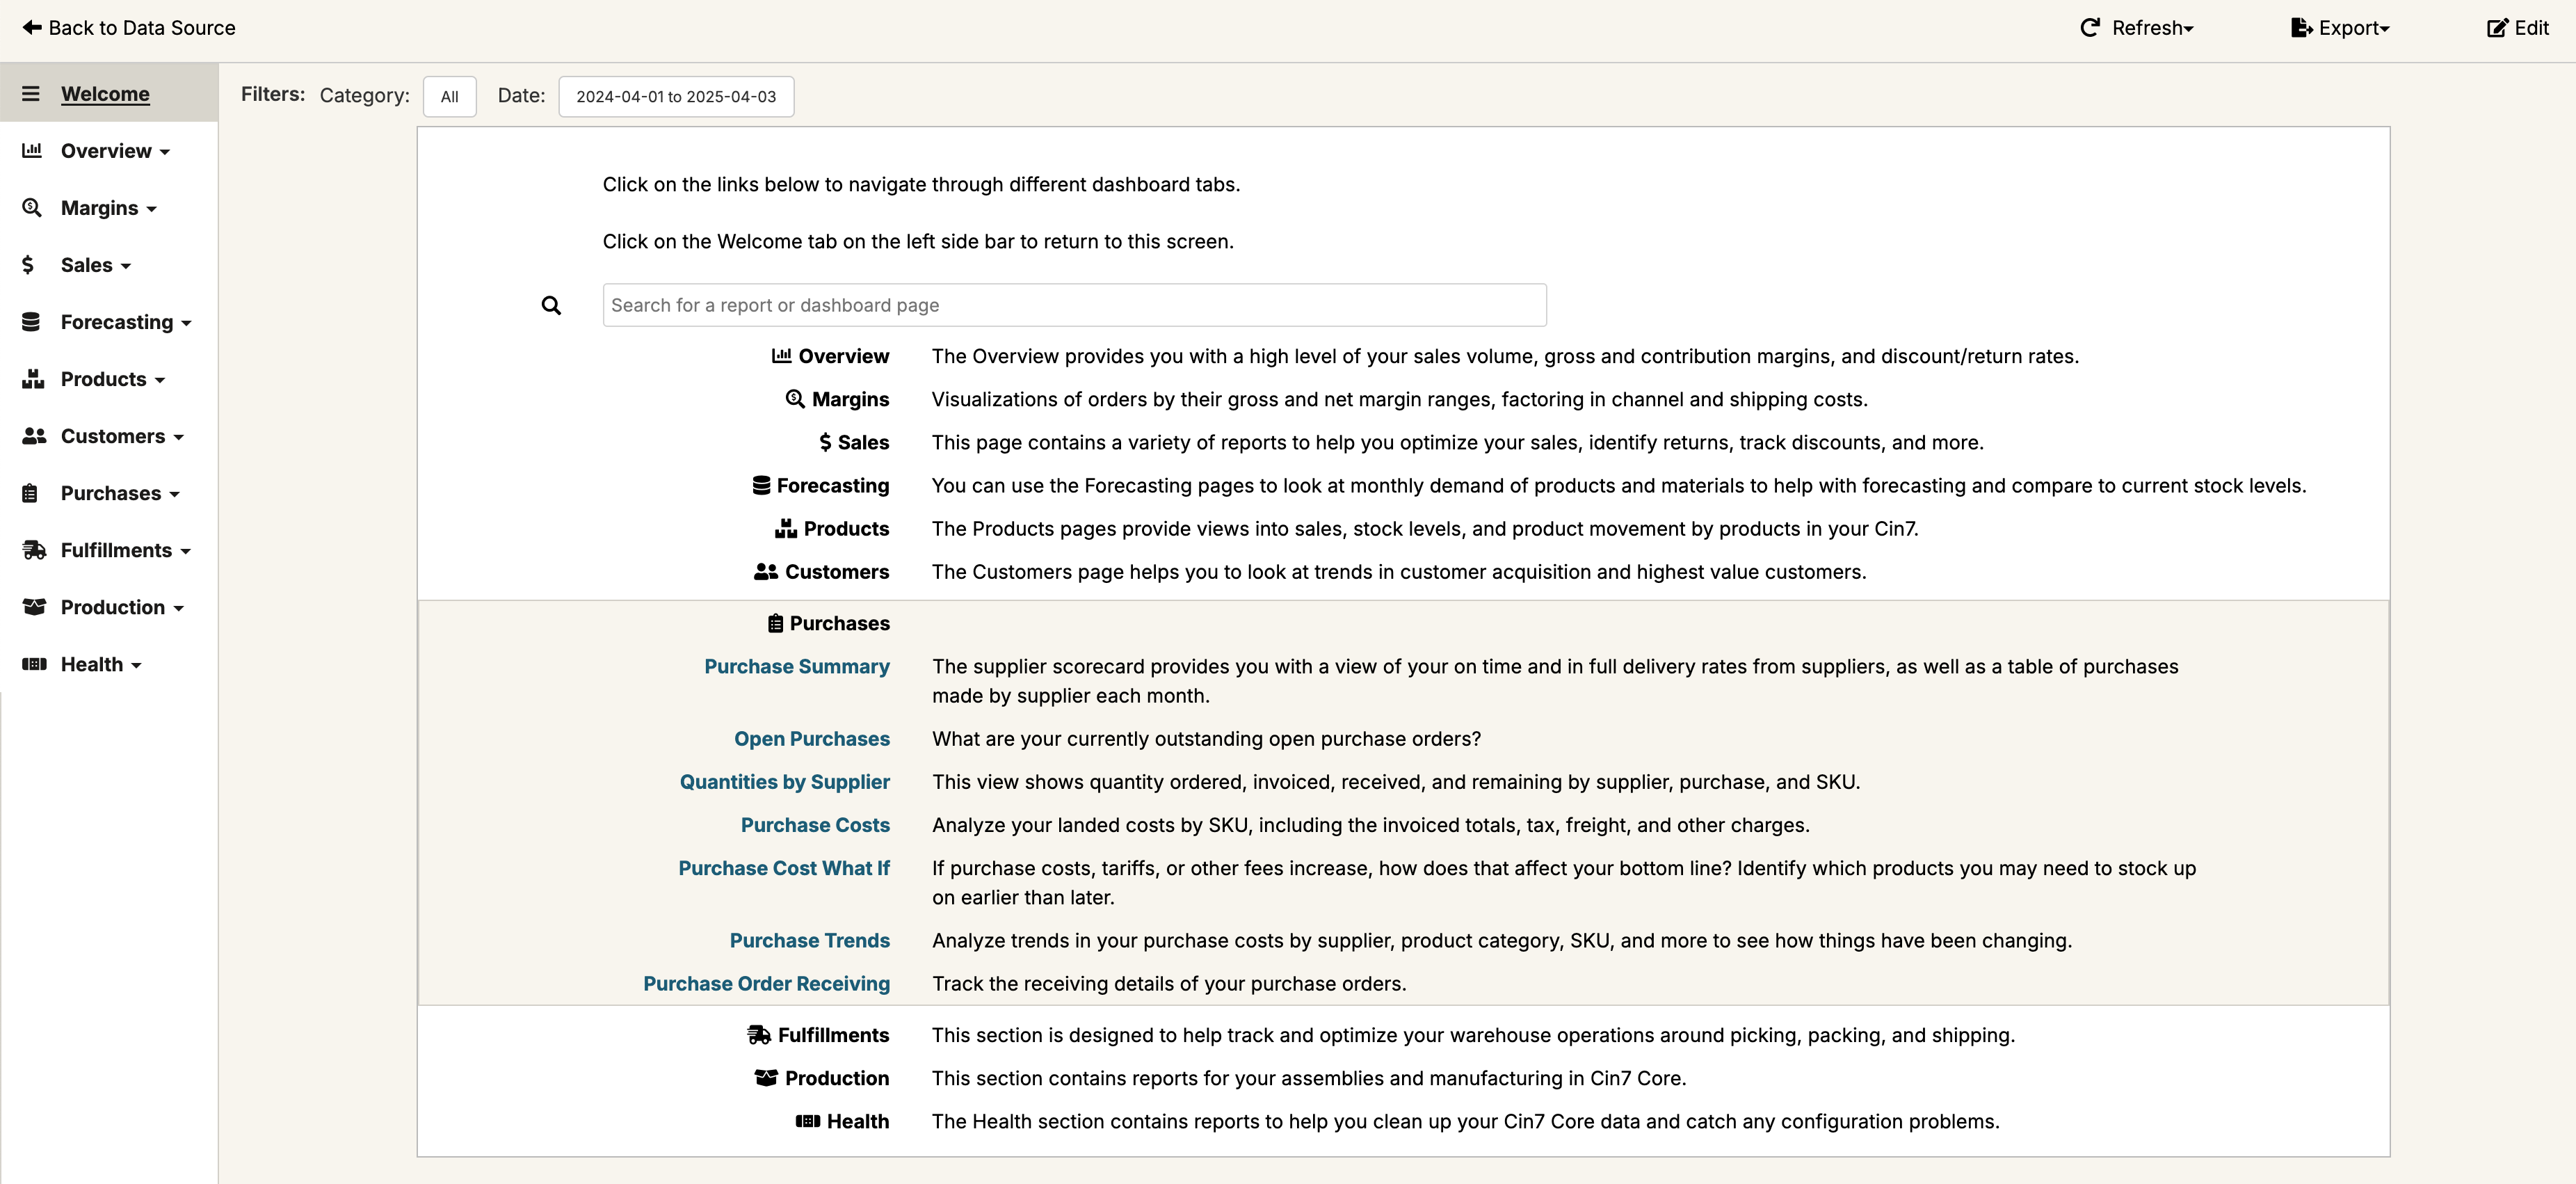
  • Table of Contents -- learn how to display a searchable table of contents for your dashboard
  • Linking Dashboards -- learn how to set up reports going across different date fields
  • Dashboard Options -- learn how to configure your dashboard

Dashboards combine multiple reports into a single page. To get started, open up an existing dashboard or create a new one by selecting the data source you want to create the dashboard on. Select "Create", then choose "Create Dashboard".

Easy Insight offers its original dashboard editor and a new dashboard editor. If you're not already in the new dashboard editor, click on 'Try our new dashboard editor!' at the top of the screen.

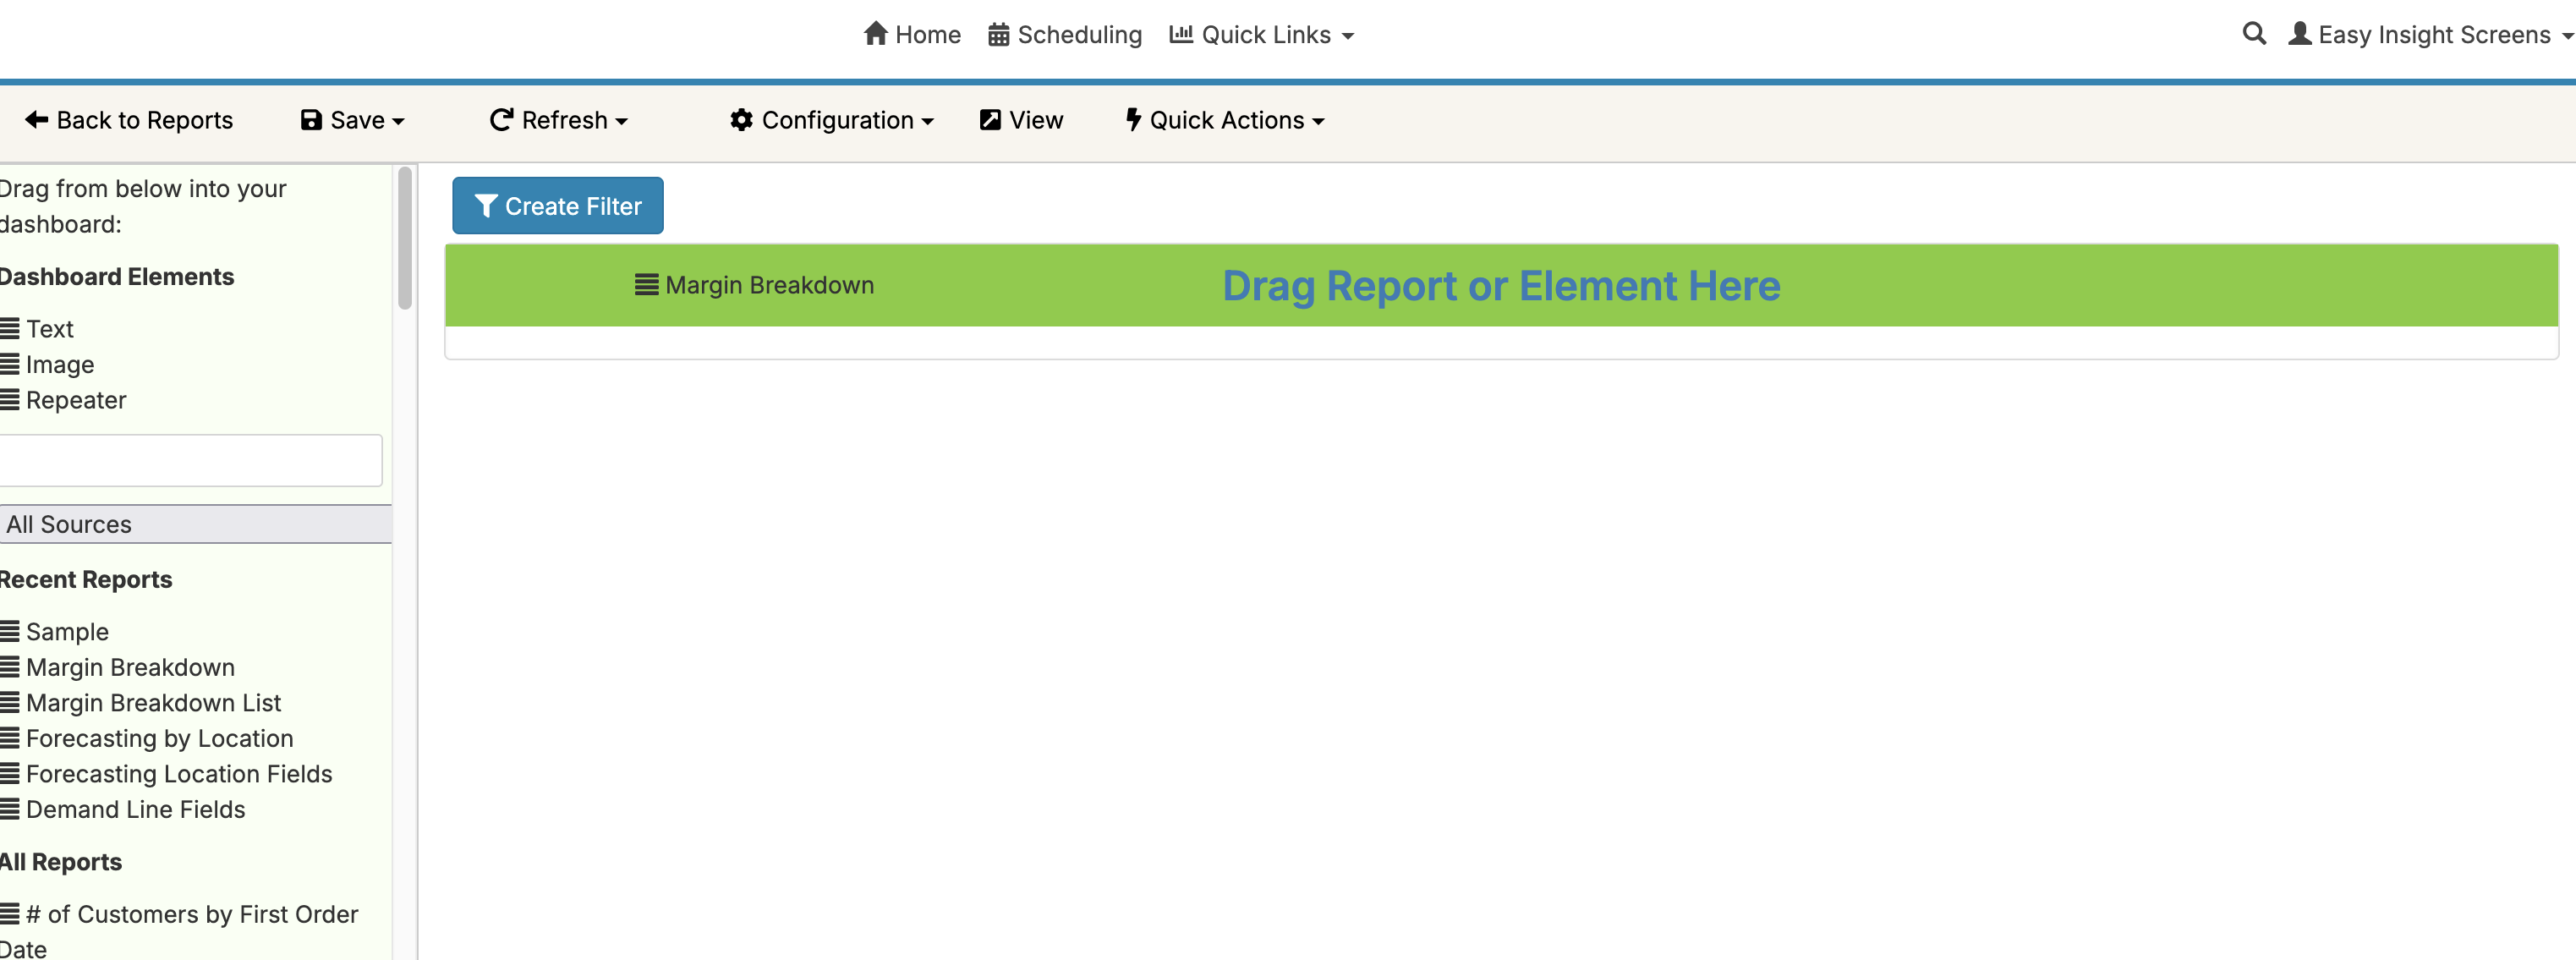
Once you're in the new dashboard editor, you can simply drag reports, text, and image components into the dashboard:

You can create different report layouts on the dashboard by dragging new reports into the dashboard. Your reports are shown in the left of the dashboard editor, with your recently updated reports at the top, then all reports below. Click on the report name, then drag it to where it says 'Drag Report or Element Here':

Tab Dashboard Image

When adding another report to the dashboard, drag it next to the existing report to position the second report relative to the first. For example, in the screenshot below, we're dragging a new report below the first:

Tab Dashboard Image

You can also pick up existing reports in your dashboard by clicking on the Move icon next to the report name and moving the report to a new position on the dashboard:

Tab Dashboard Image

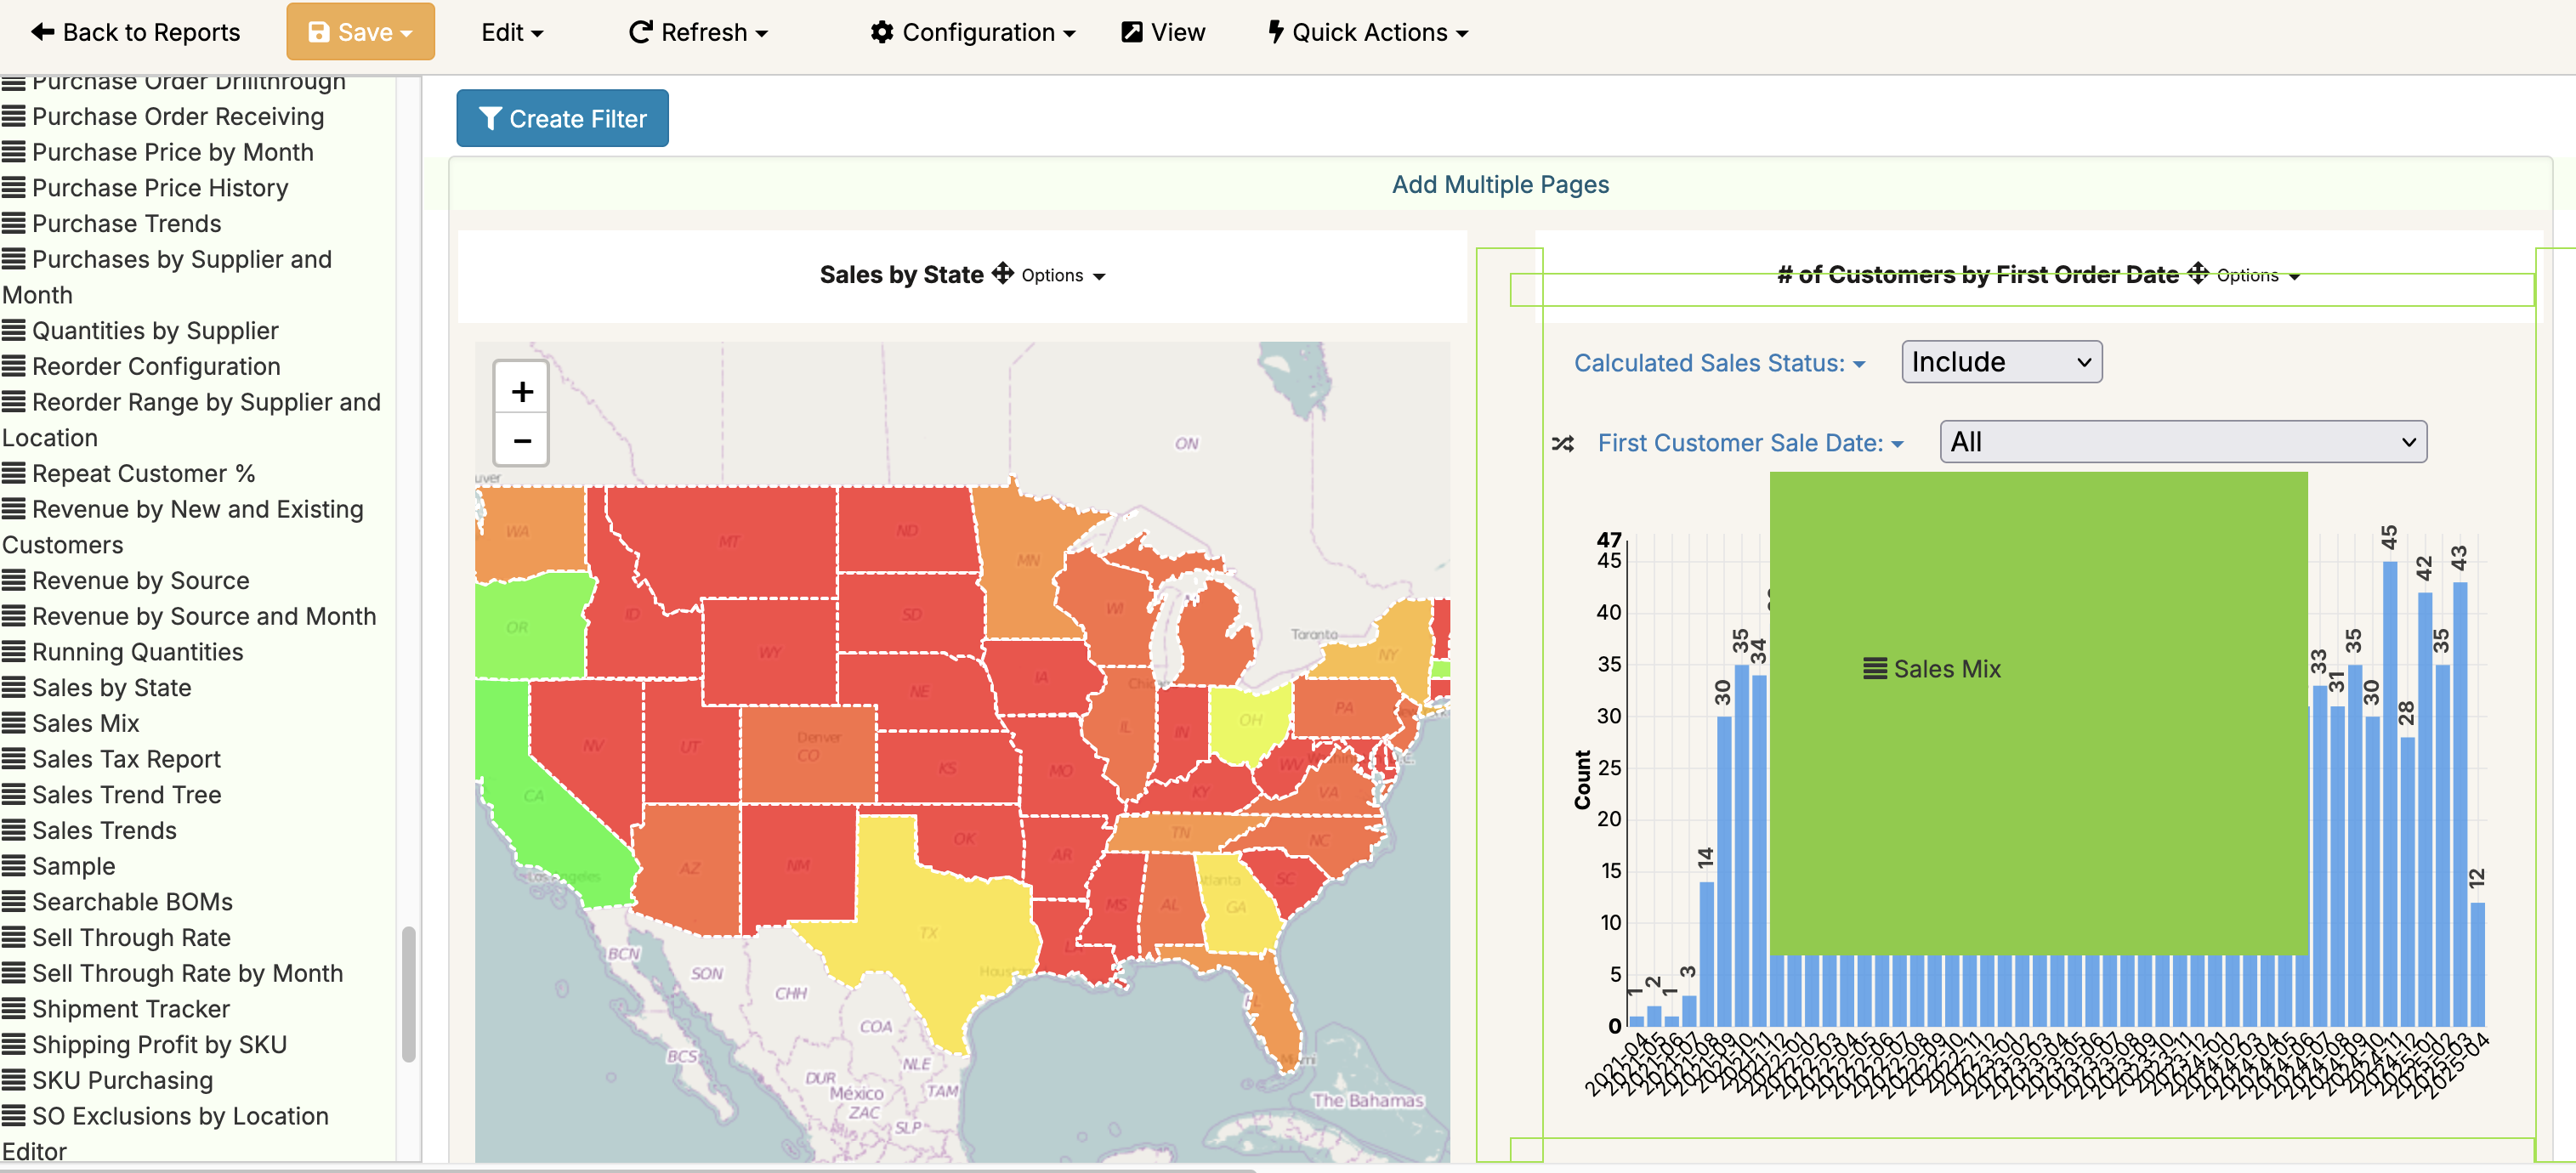
By dropping a report on top of an existing report, you can easily replace an existing report with a new report:

Tab Dashboard Image
Dashboard Level Filters

If you put filters at the top of the dashboard, these filters will automatically apply across all reports in the dashboard.

Tab Dashboard Image

For more information on how dashboard and report filters interact, see Dashboard and Report Filters.

Dashboard Pages

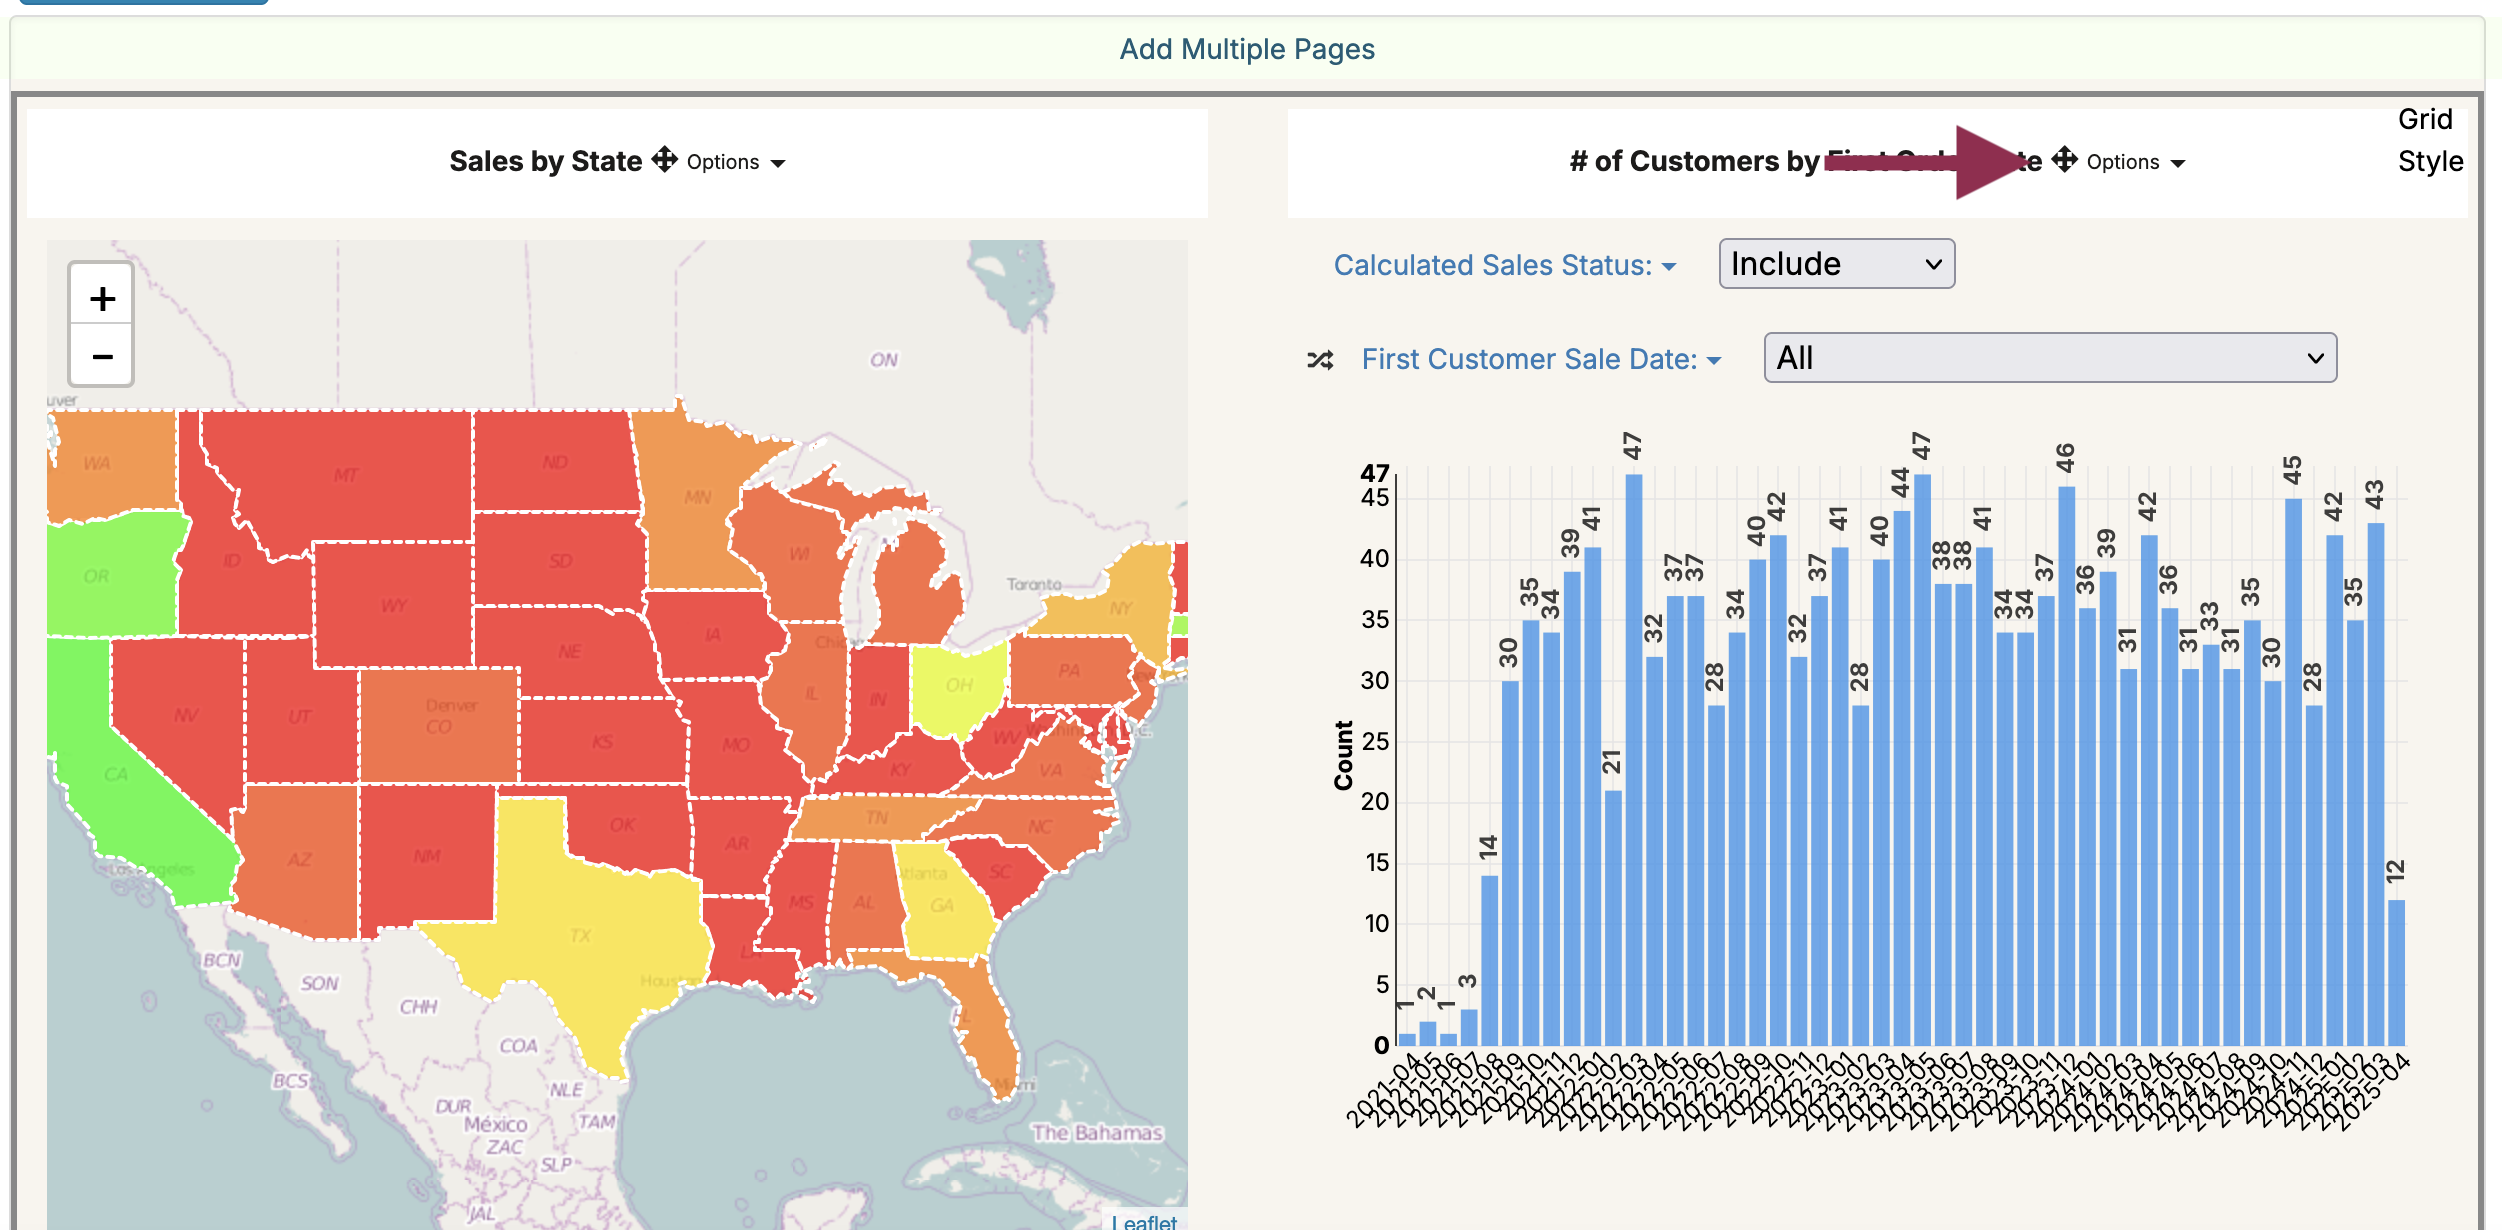
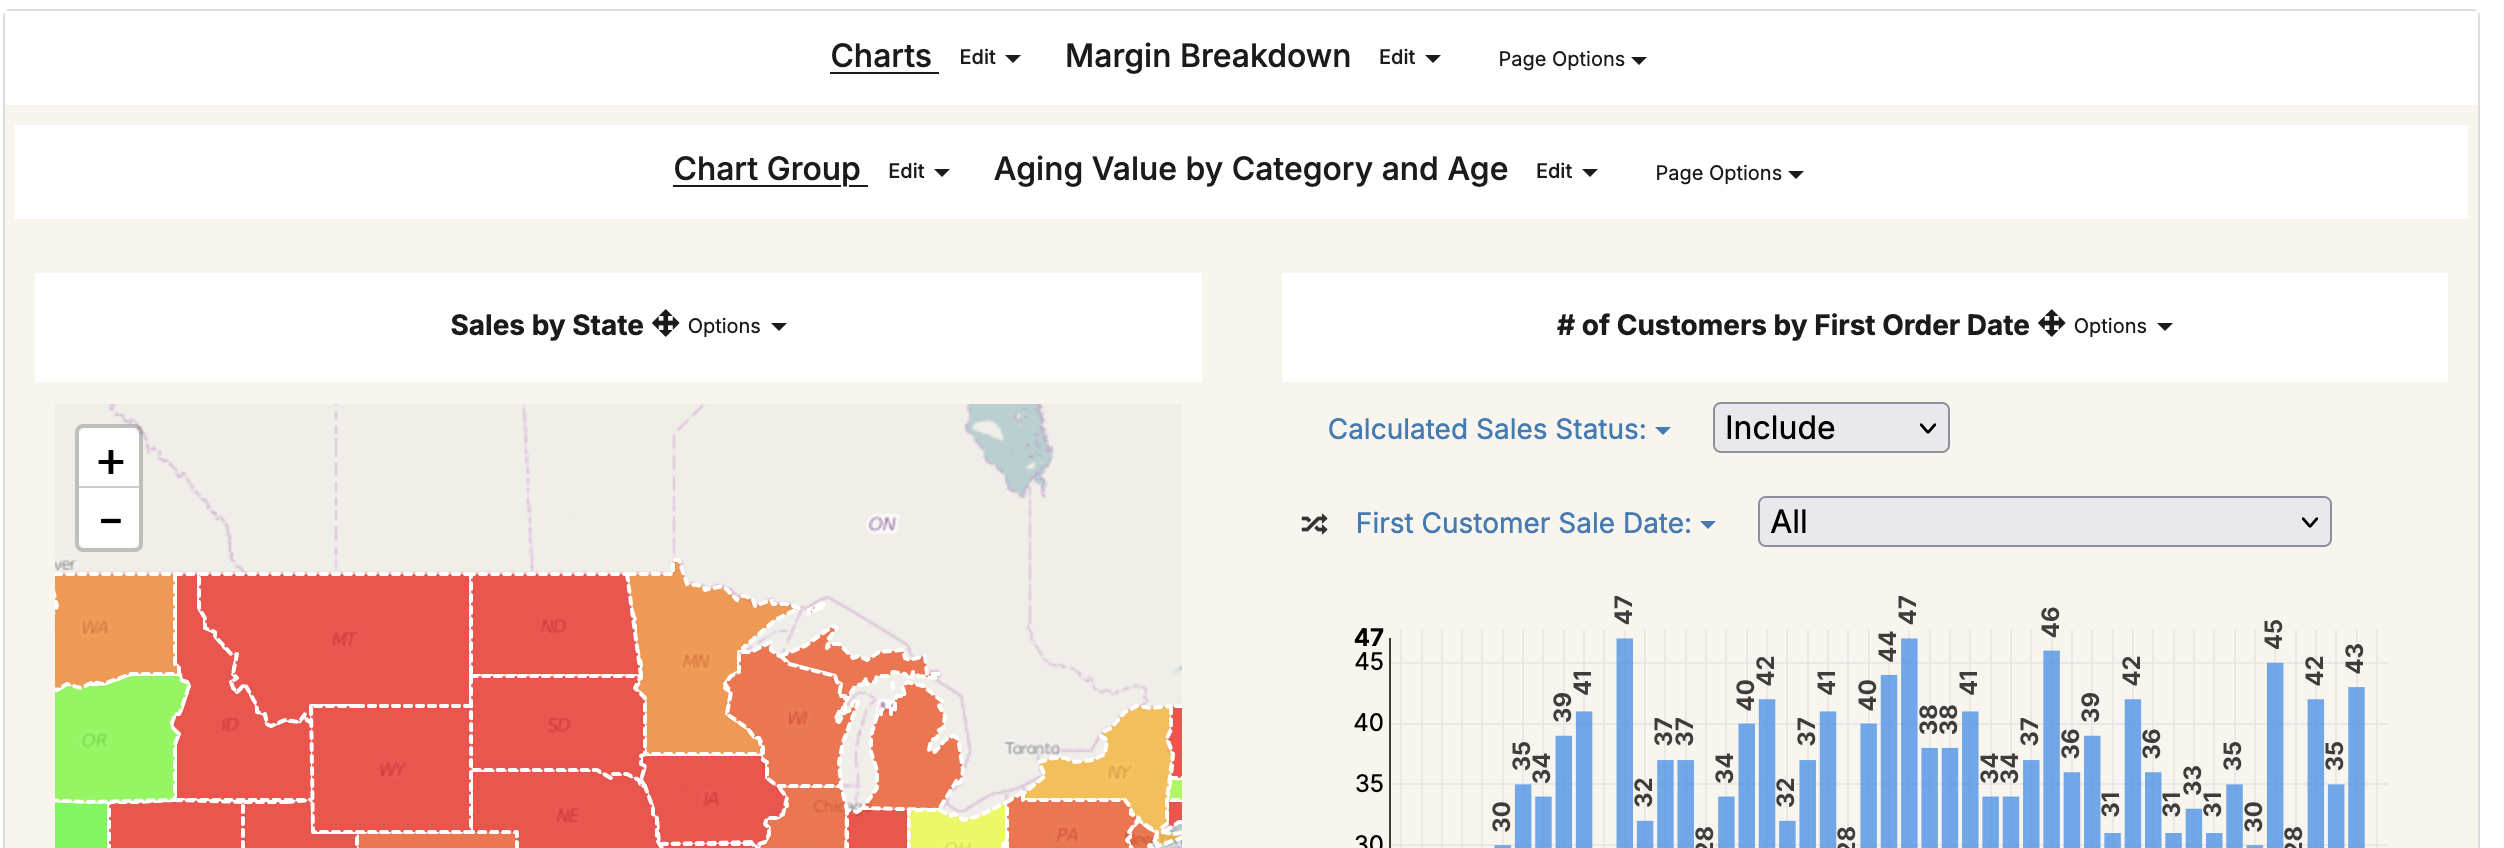
You can divide a dashboard into multiple pages by clicking on the ‘Add Multiple Pages’ link at the top of the dashboard:

Tab Dashboard Image

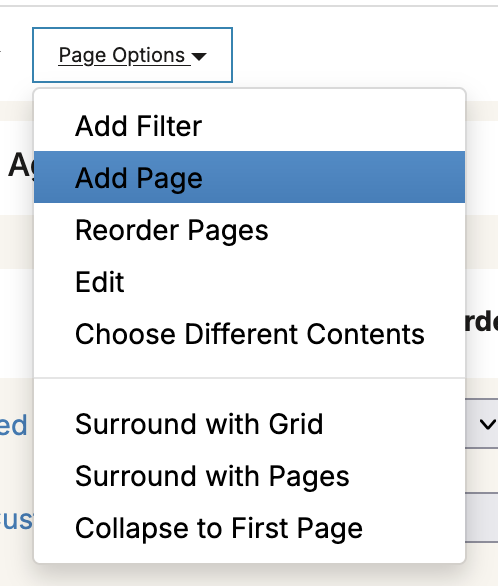
Once you have multiple pages on your dashboard, you can add new pages by clicking on Page Options -> Add Page:

Tab Dashboard Image

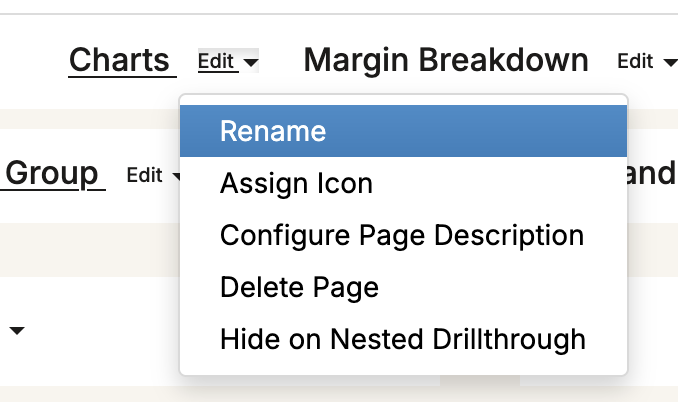
You can rename a page by clicking on the Edit link next to the page and clicking on Rename:

Tab Dashboard Image

You can add a further set of nested pages within a page by clicking on Add Sub Pages:

Tab Dashboard Image

You can assign an icon to the page by clicking on Assign Icon and you can configure a description for the page by clicking on Configure Page Description. This page description is used in the table of contents:

Tab Dashboard Image

Once you have a dashboard assembled, you can click the Save button in the upper left. Click on View to see the dashboard in the non-editor version.

Putting Filters on a Single Page

If you want to put filters on a single dashboard page, you can put a single Page in the section where you want the filter, then define the filters by clicking on Page Options and doing Add Filter.

Twitter Logo