Dashboards can have their own filters, which in turn can have relationships to the filters on reports within the dashboard.
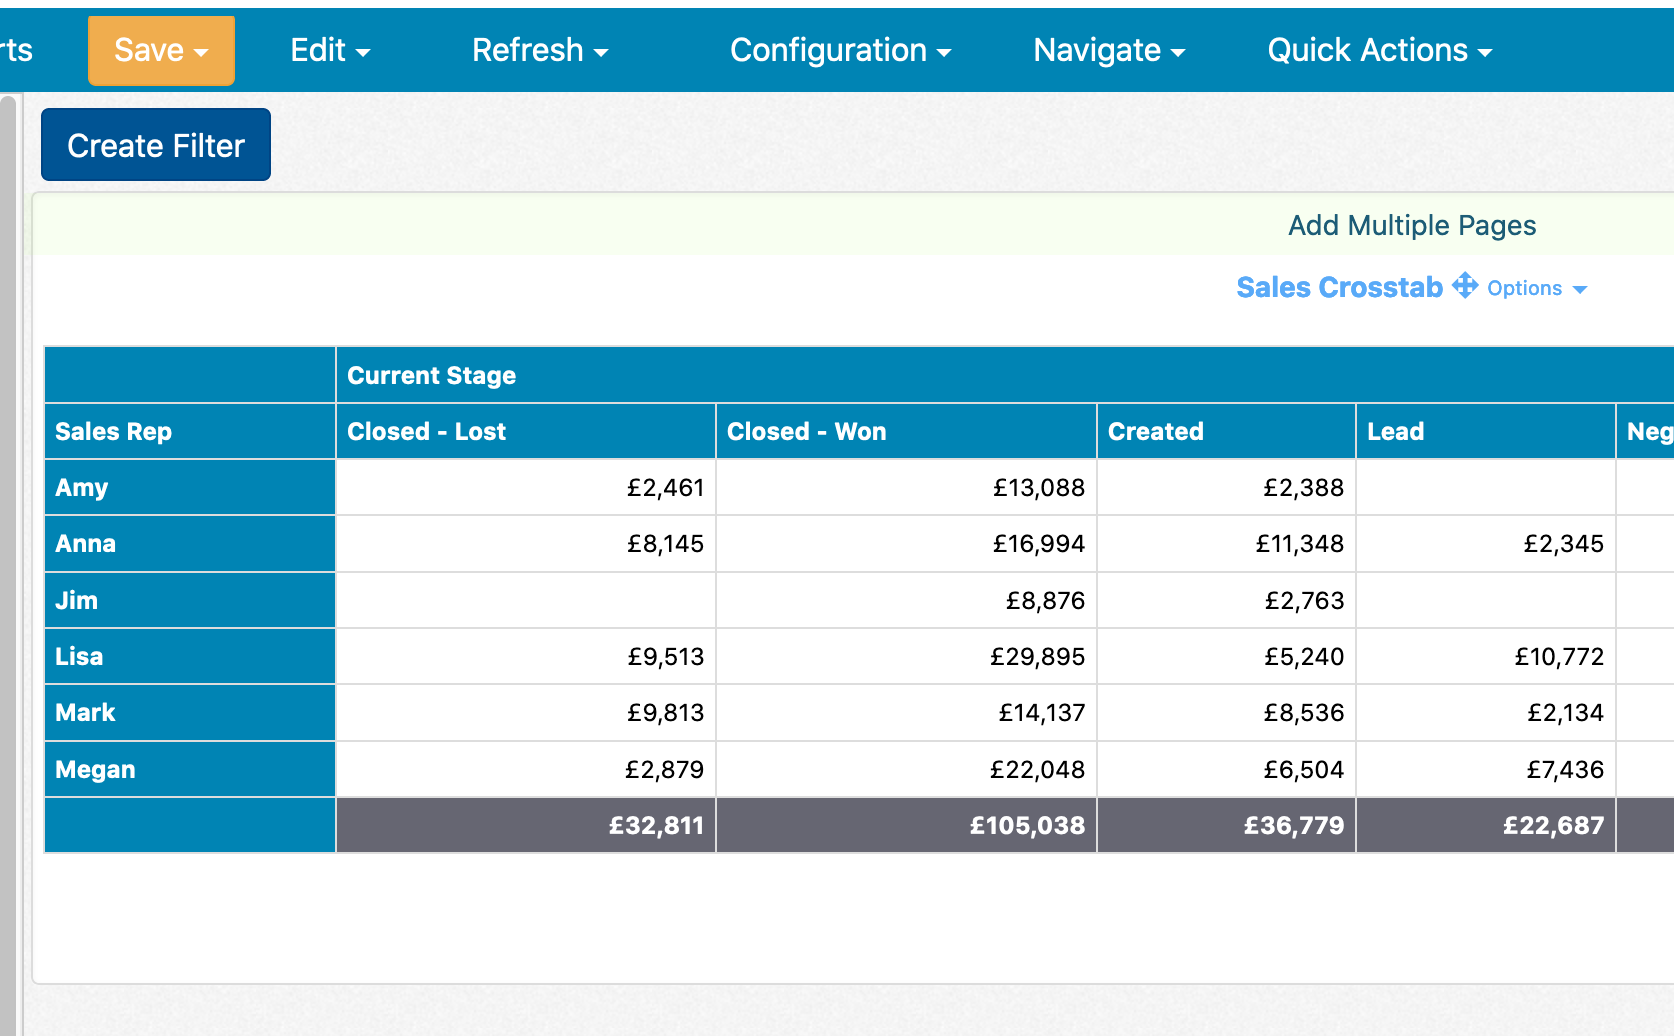
You can create filters at the dashboard level by clicking on the Create Filter button in the upper left of the dashboard editor:
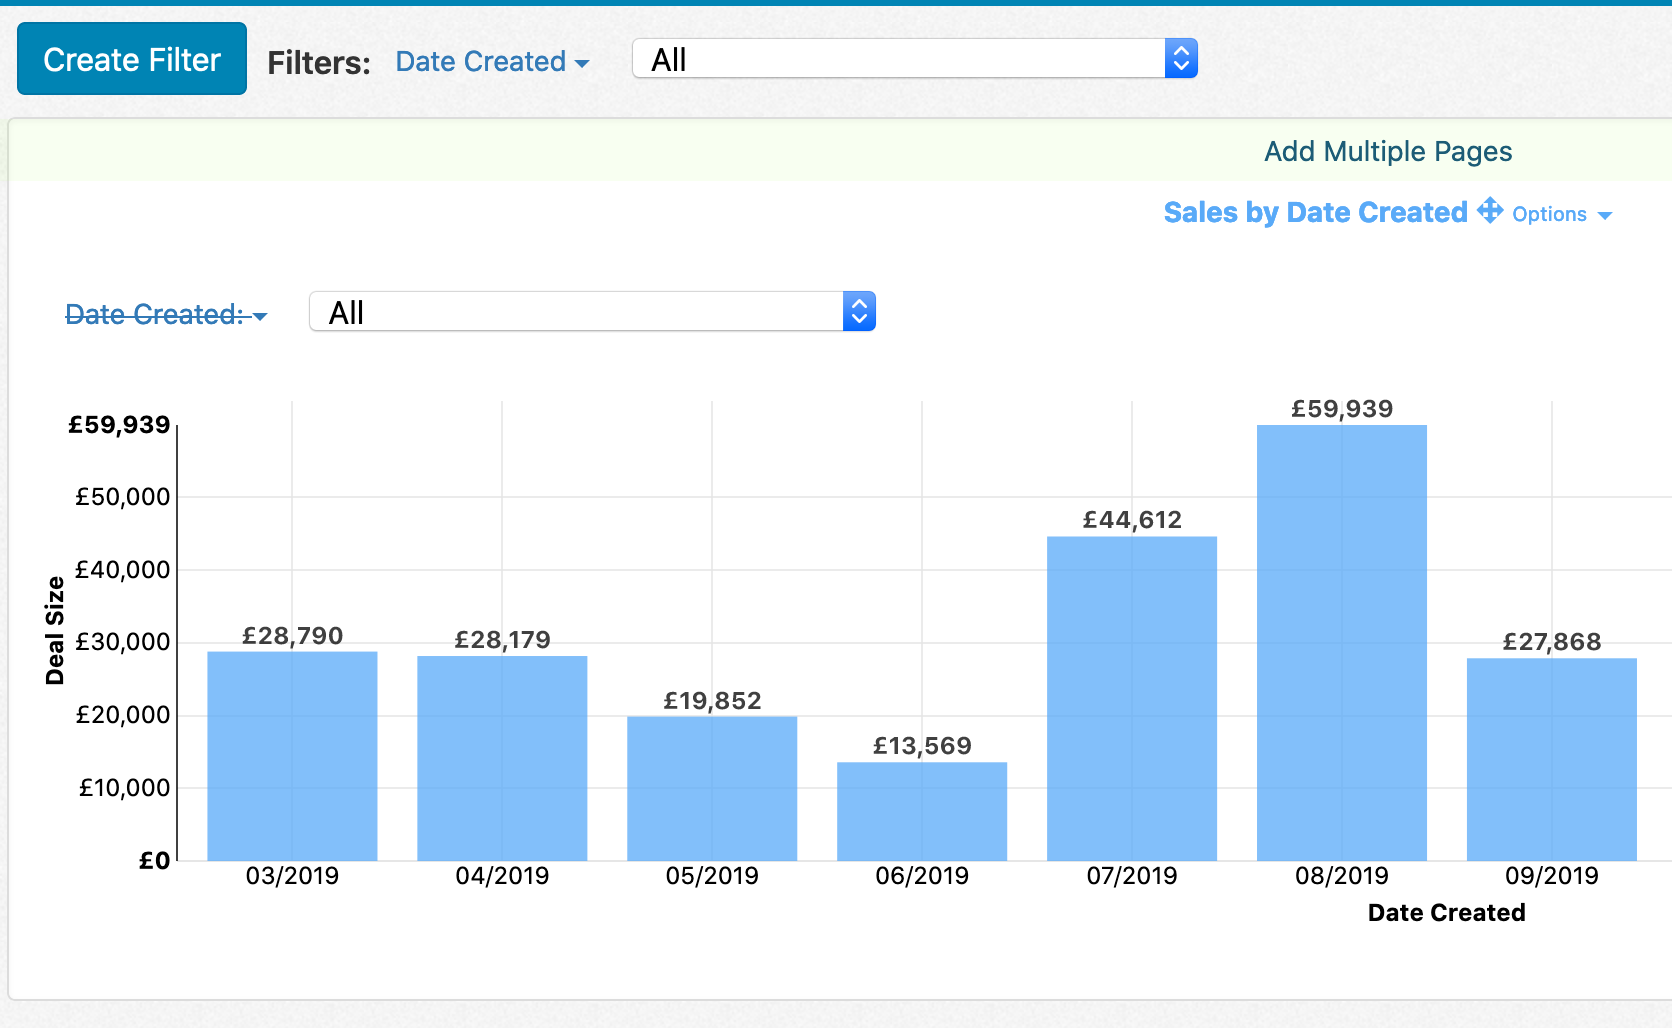
When you create a filter at the dashboard level, it applies to all of the reports within the dashboard. If a filter on the same field is present on a report in the dashboard, the report filter will be hidden when the dashboard is in the end user view. This relationship is shown in the dashboard editor by drawing a strikethrough on the report filter to indicate that the dashboard level filter takes precedence:
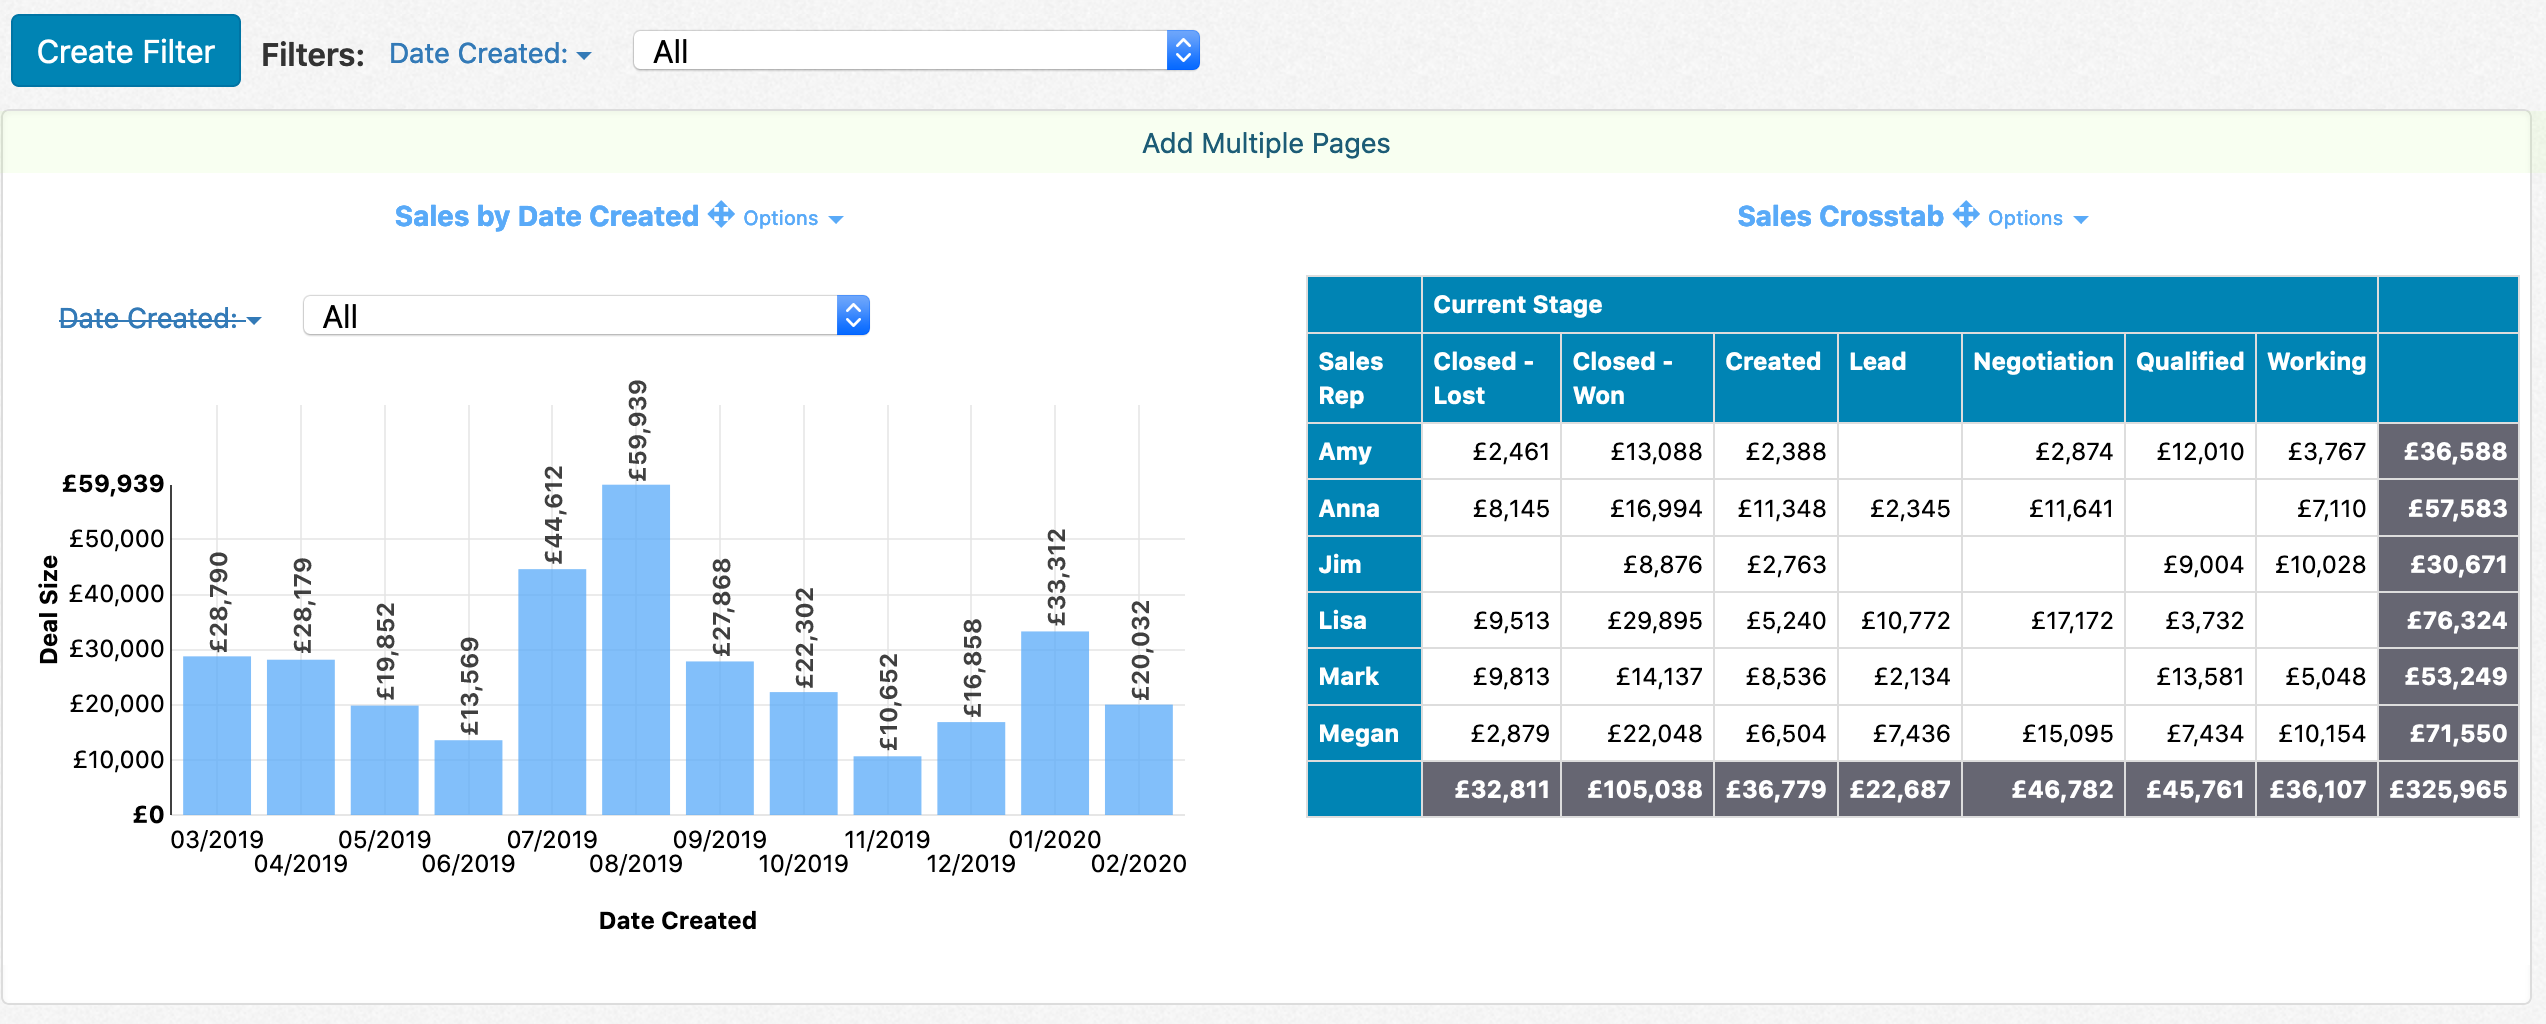
For the above example, the end user view of the dashboard looks like the following:
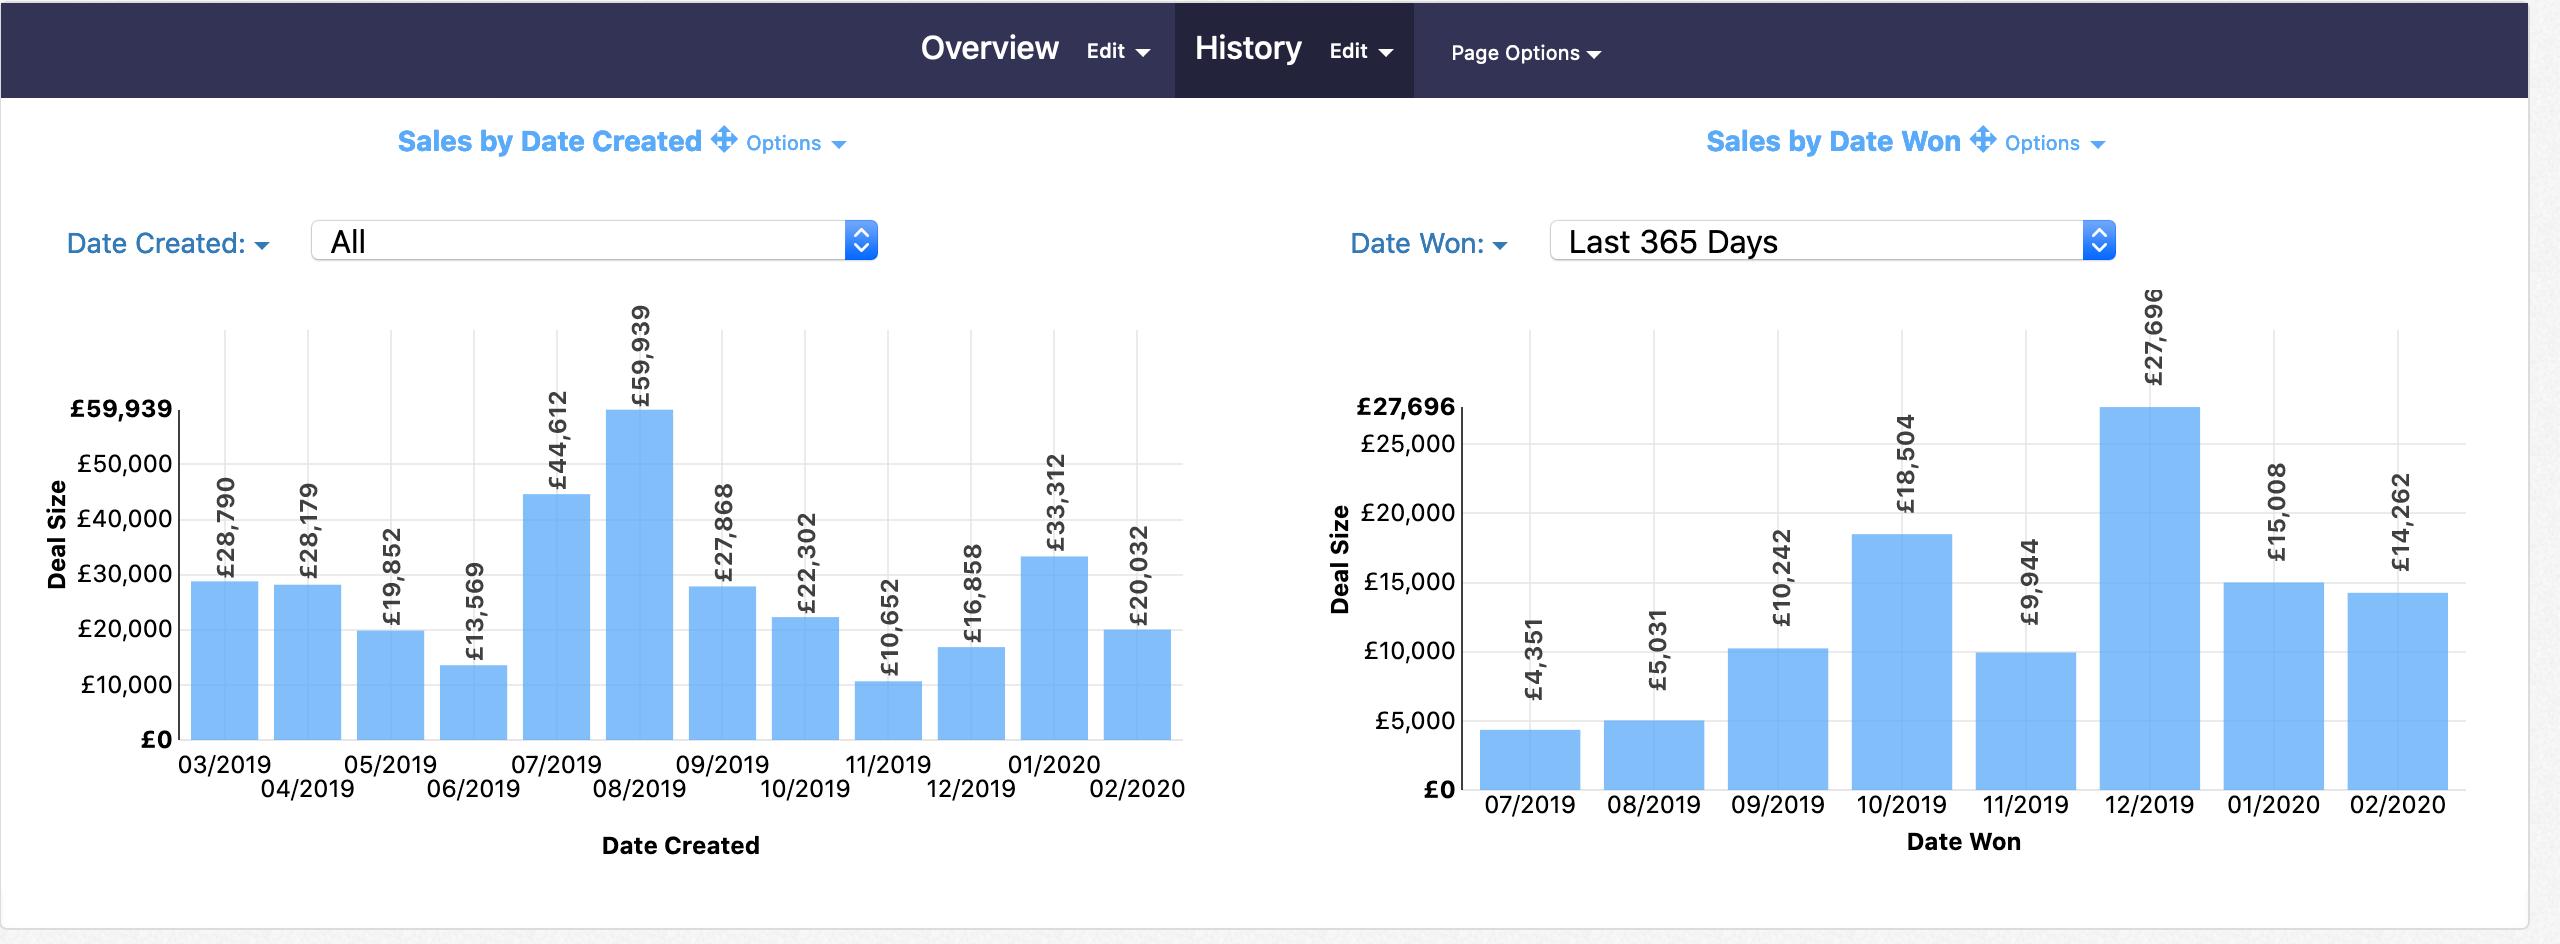
You can also create filters at the page level. For example, in the following dashboard, you might want to apply a date filter on the History tab only:
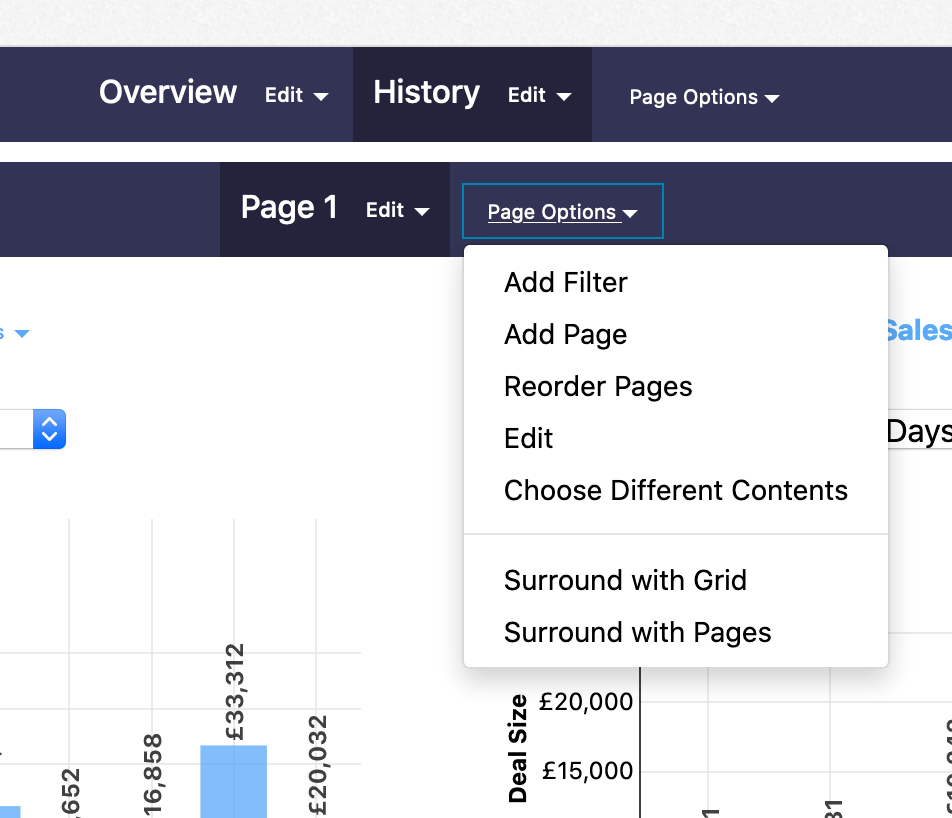
You'll want to create a nested page on the History page to contain the filter. Click on the Edit link next to the History page and do 'Add Sub Pages'. This action will create a nested page. The page controls won't show since there's a single tab, but you can create filters at this page level. To create a filter, click on Page Options -> Add Filter:
The resulting filter is only shown on the dashboard when you navigate to that particular page.
Next, let's dig into a further example on the History page. We might want to have a Date filter on the History page, but that date in turn needs to map to Date Created on one report and to Date Won on a second report.
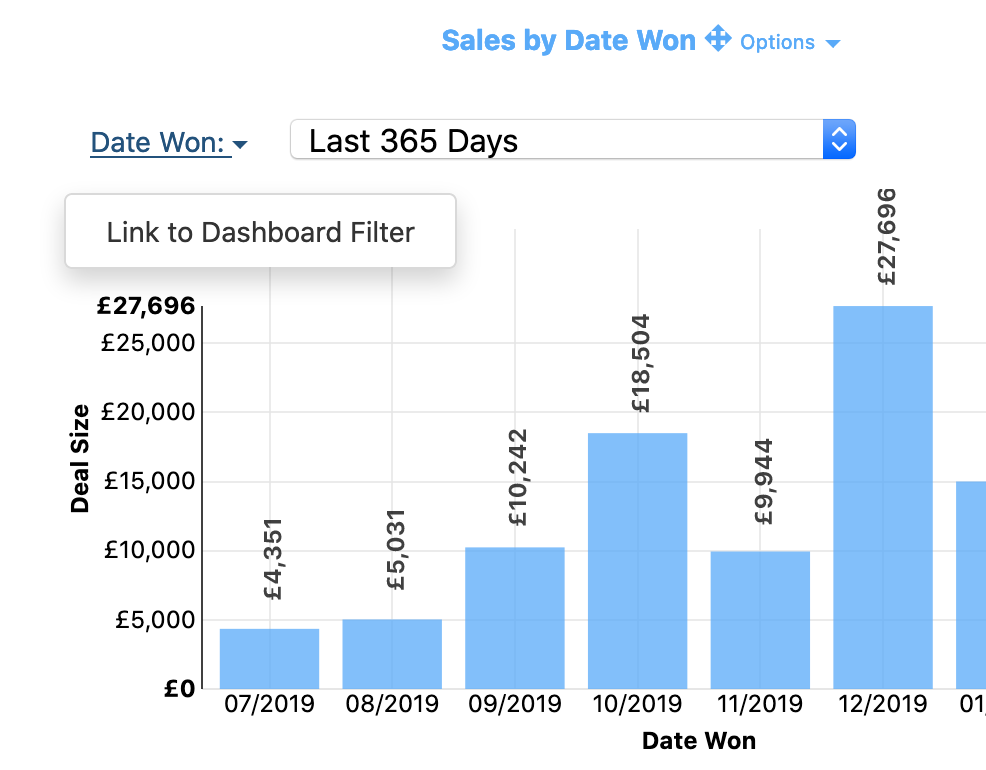
Within the editor, you can click on the report level filter and choose 'Link to Dashboard Filter':
The window that pops up gives you the list of possible dashboard filters you can link the report filter to:
When linked, the dashboard level filter will be applied to the report using the report level filter's field. So in this case, even though the dashboard level filter isn't on Date Won, it'll map to Date Won when it runs at that report level.
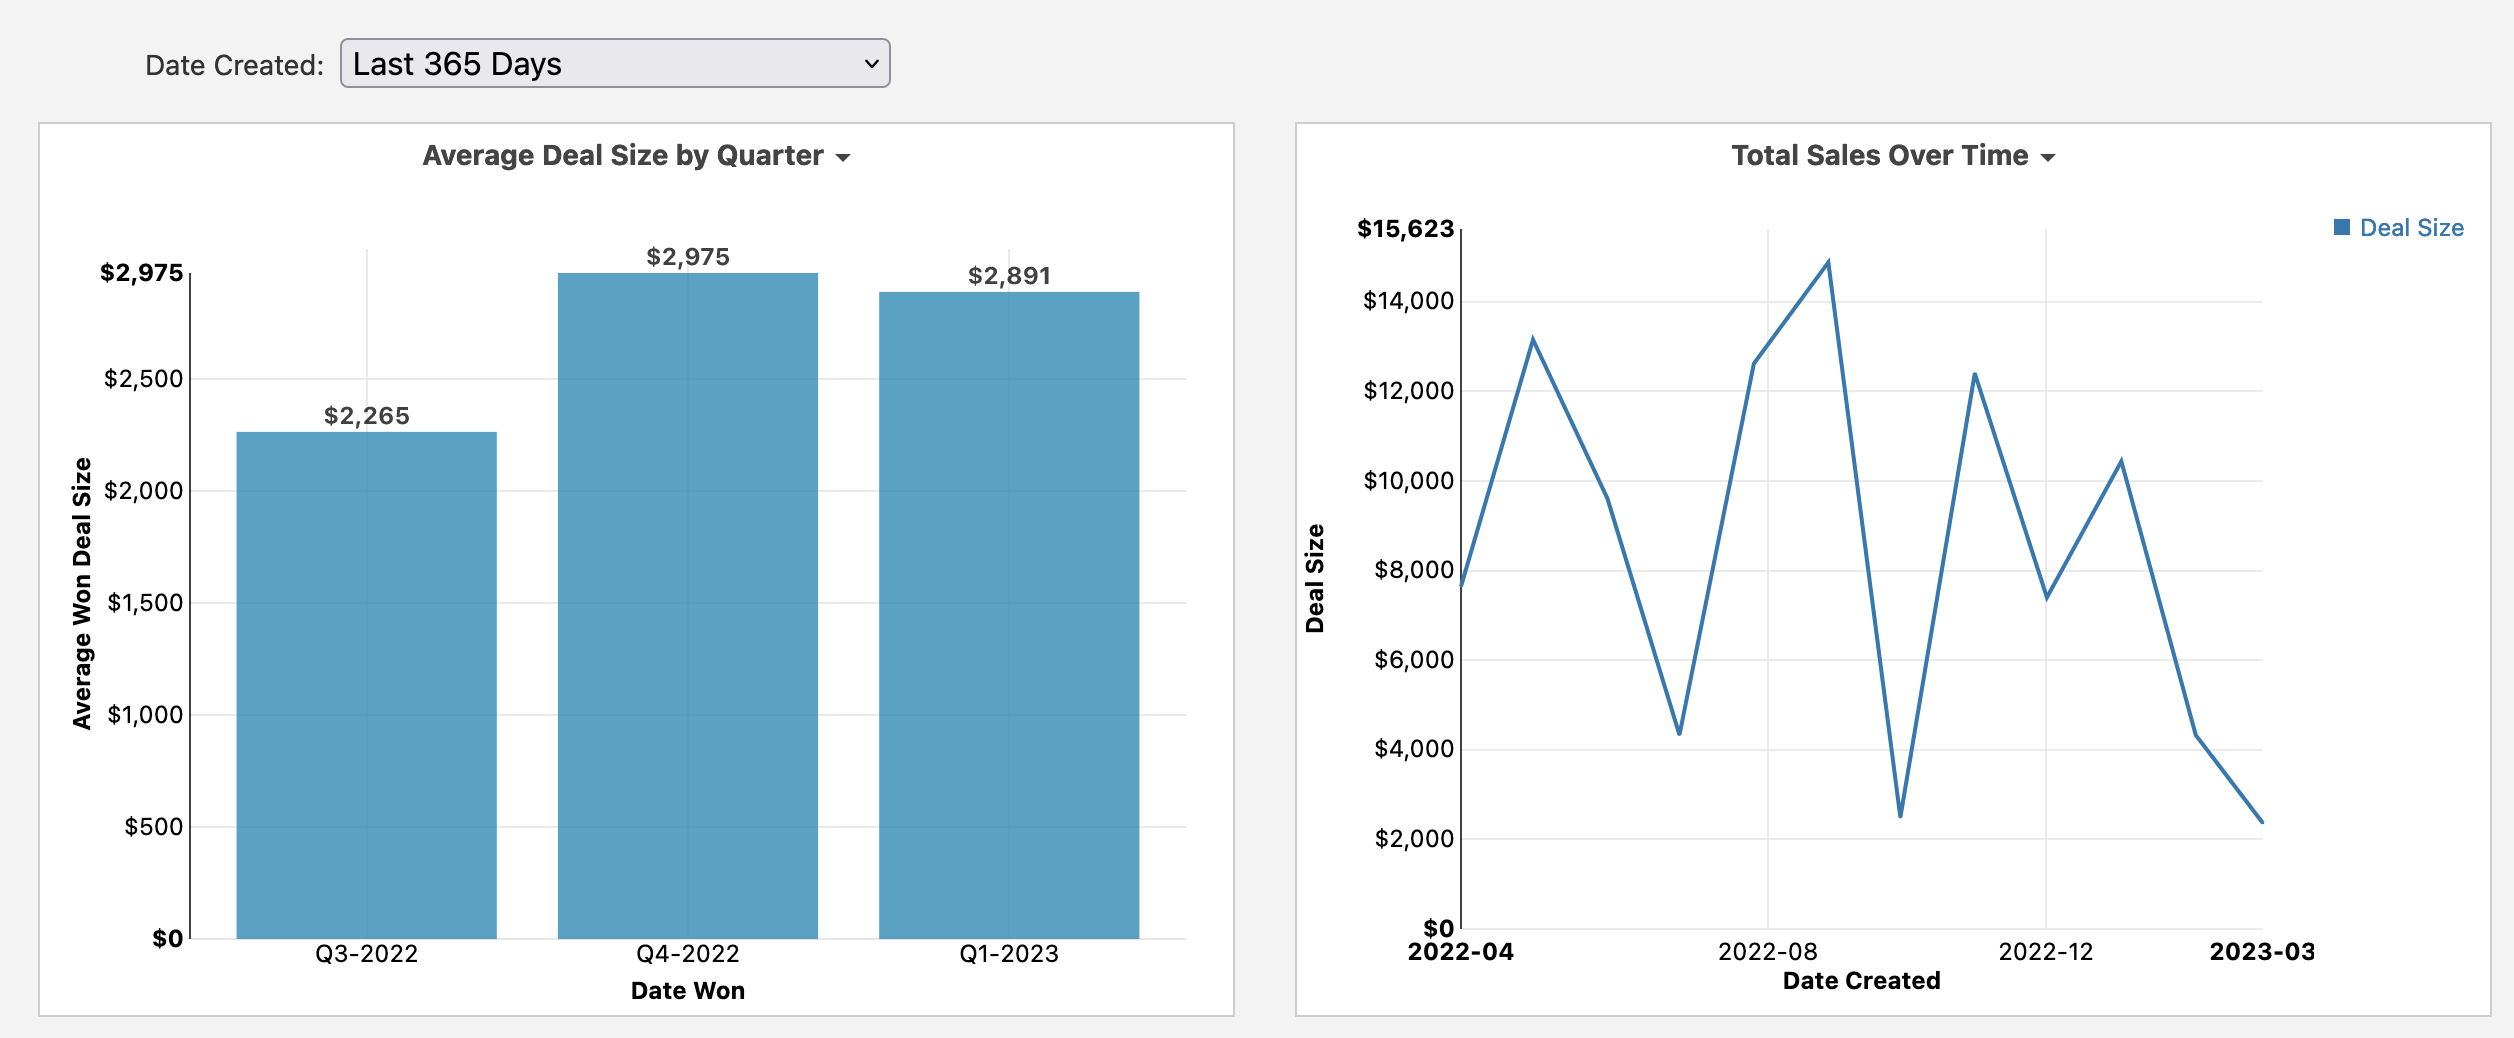
You might also have a dashboard level filter which you want a particular report to ignore. In the screenshot below, the dashboard has a filter on Date Created, but we want the line chart to ignore the filter and show data for all dates:
To ignore the dashboard filter behavior, create a filter on the report, then edit the filter and uncheck the option of 'Should this filter always be enabled (no checkbox)?':
With this option selected, uncheck the checkbox next to the filter in order to disable the filter on the report:
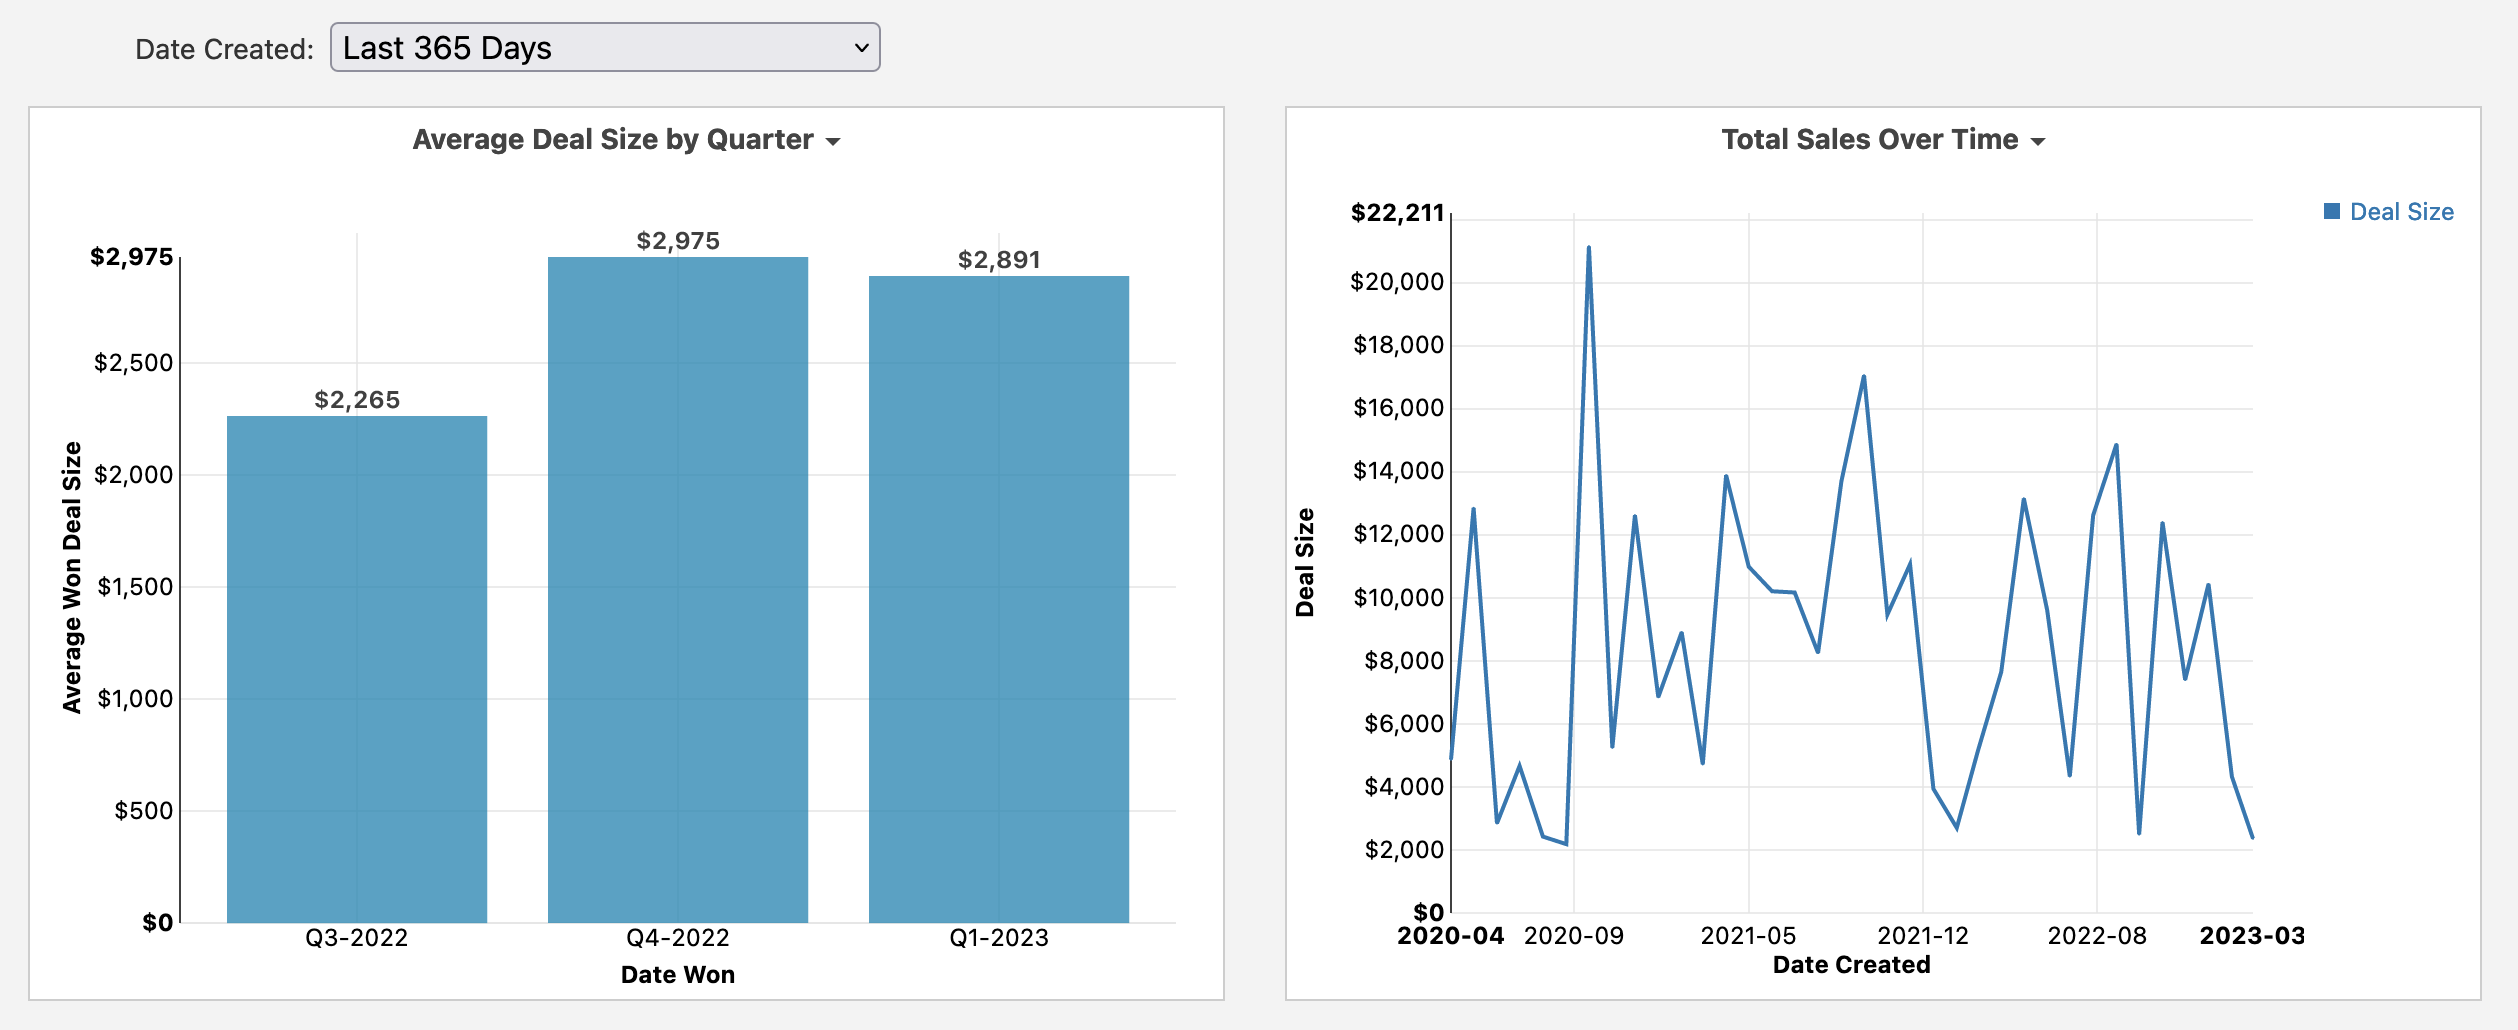
Save the report, then open the dashboard and link the report level filter to the dashboard filter as described in the previous step of linking filters. Save the dashboard and the report will ignore the dashboard filter: