Easy Insight Logo
Call 1-(720)-316-8174

Linking Reports

How do I define links off of reports?

You can set up links off of your reports to navigate to a different URL or into a different report when you click on a report element. To get started, click on the field in the report that you wish to link from and choose 'Edit this Field'. From the field edit window, click on the 'Add links to URLs or other reports' as shown below:

Basic Linking

How do I link to external URLs from a report?

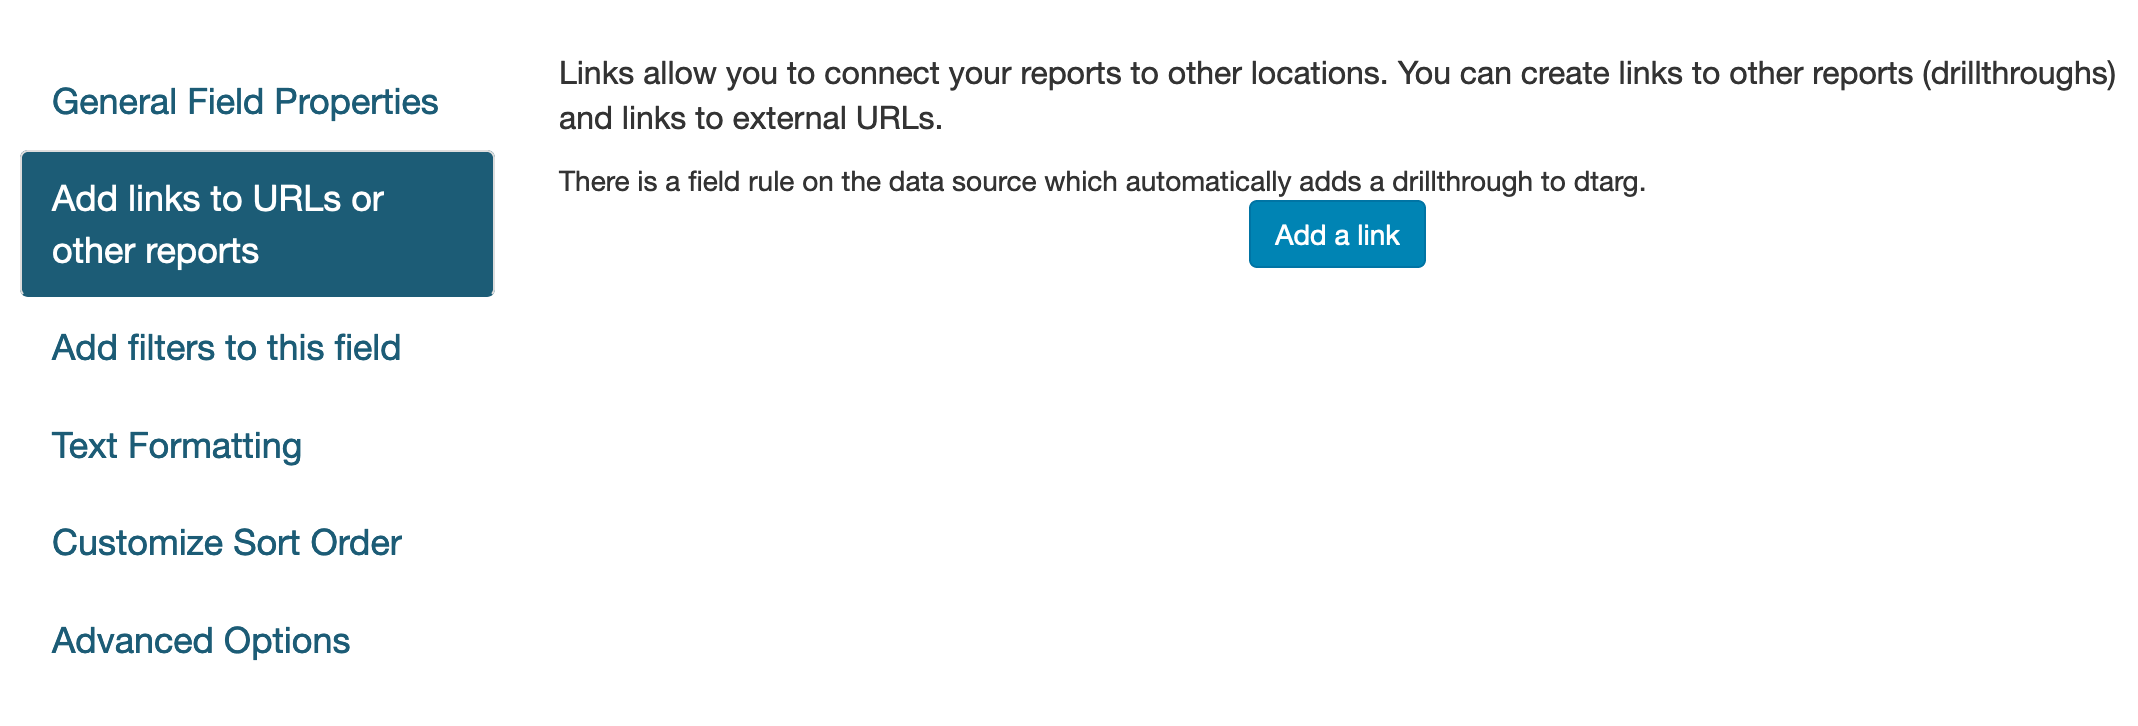
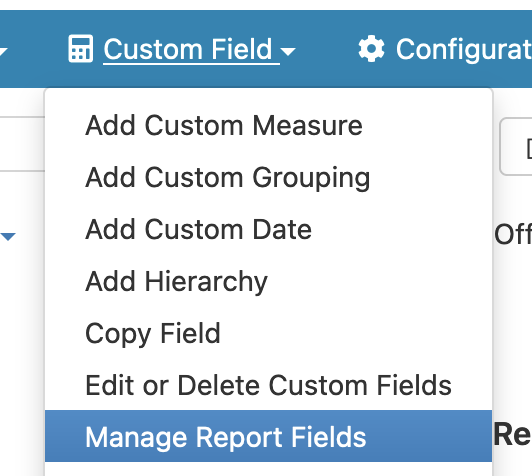
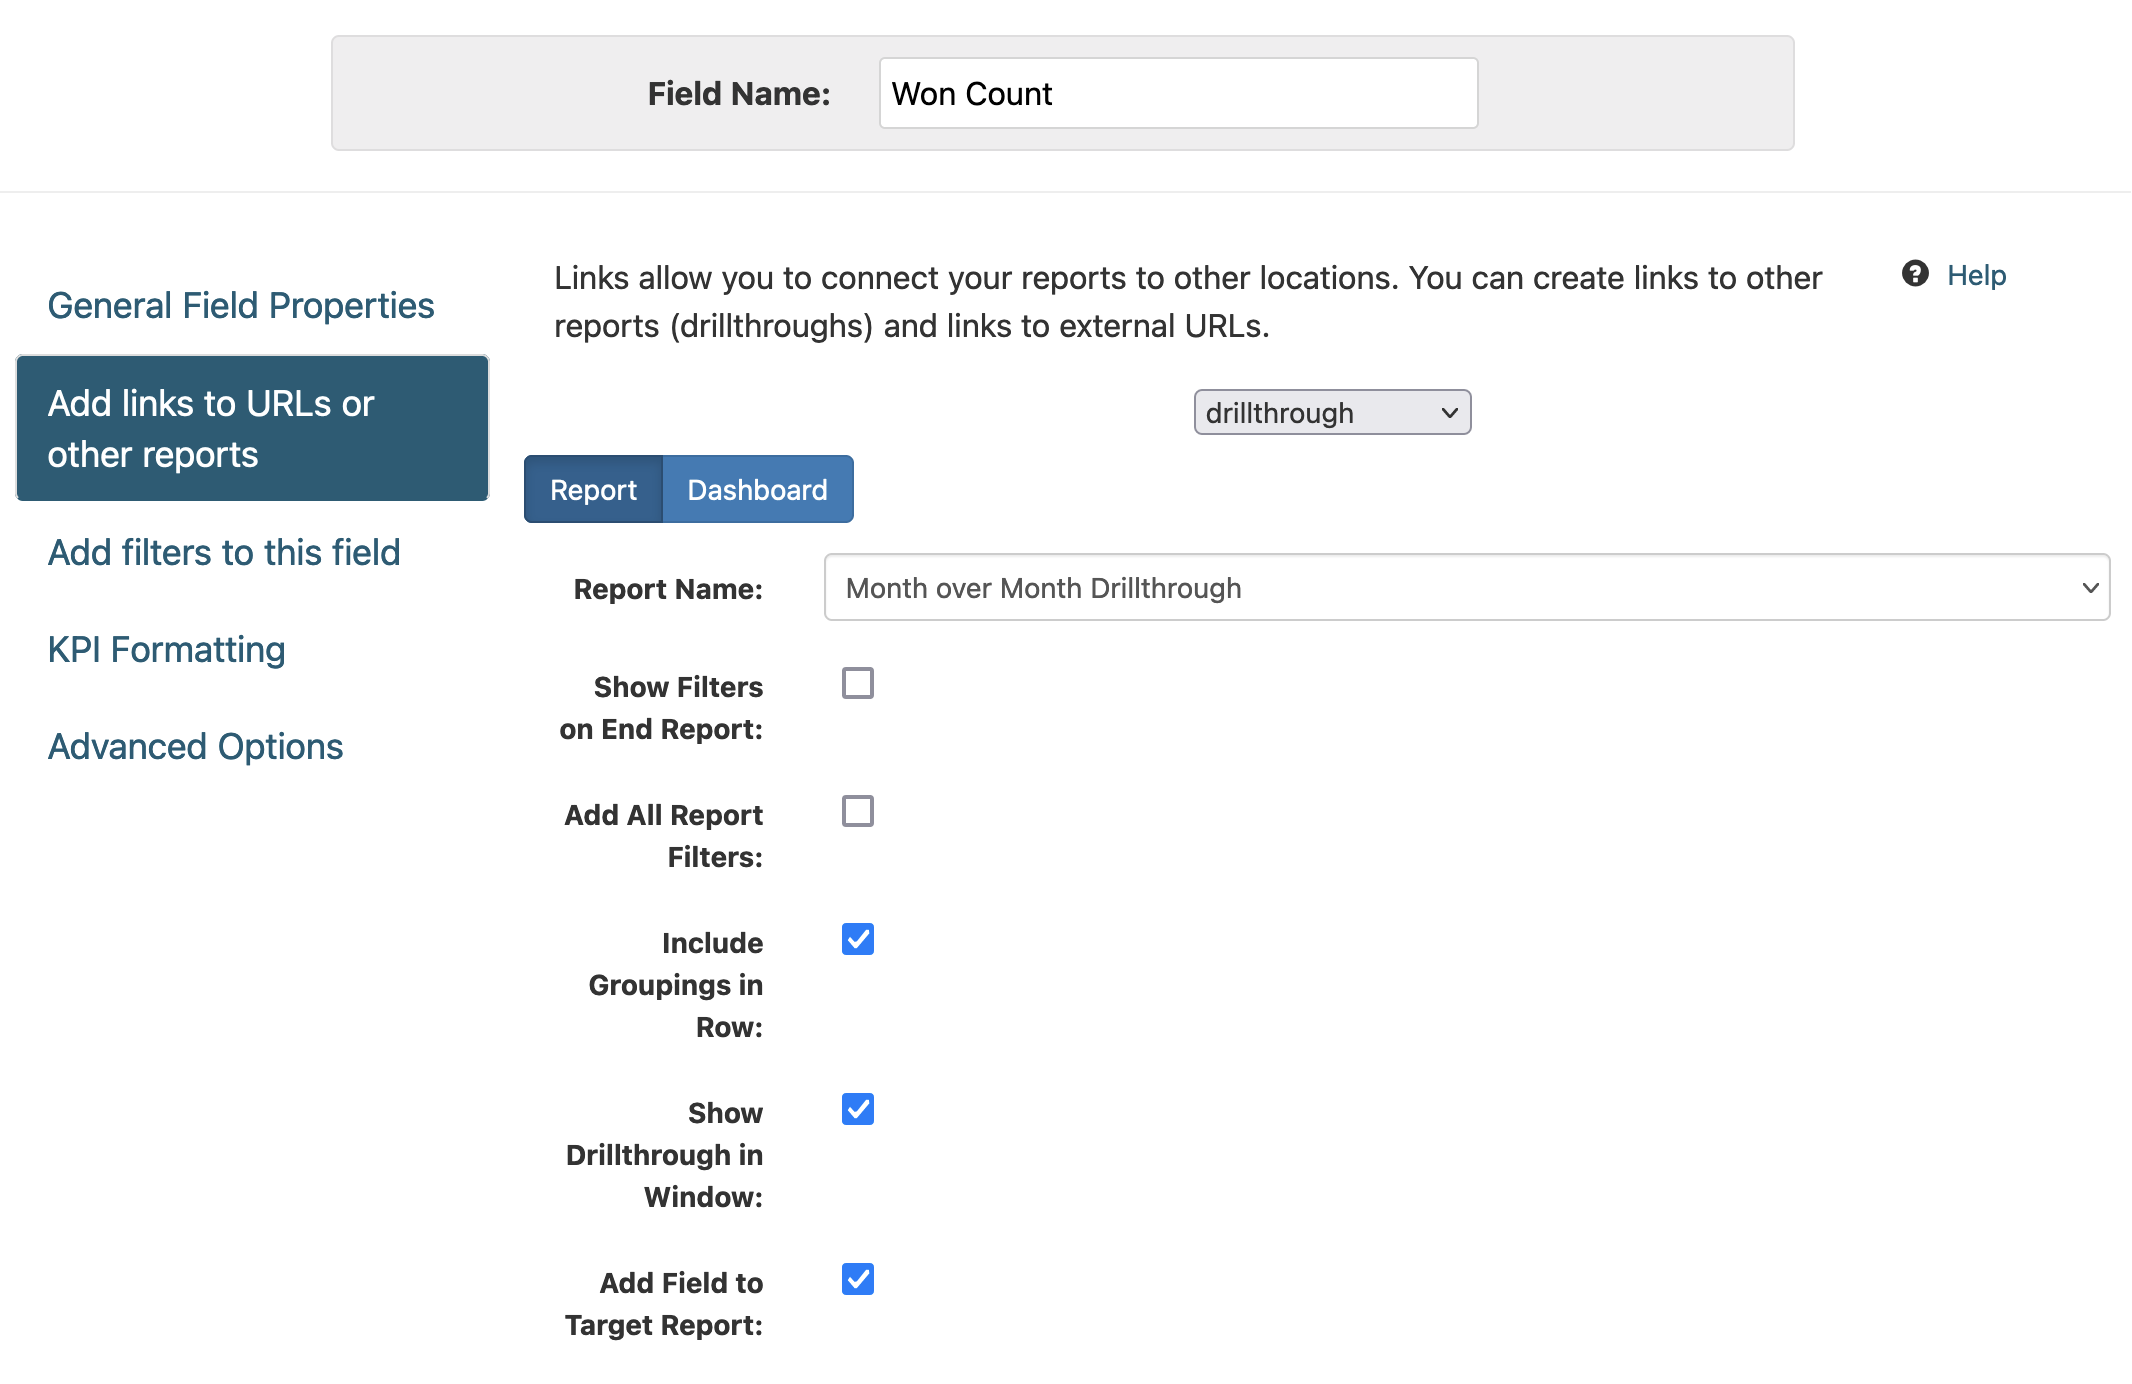
You can link back to actionable information from your Easy Insight reports by defining URL links. For example, you might want to be able to click back to the project screen on a project management system, or to a deal detail screen on a CRM system. Click on the Create Link button and choose 'URL' as the link type.

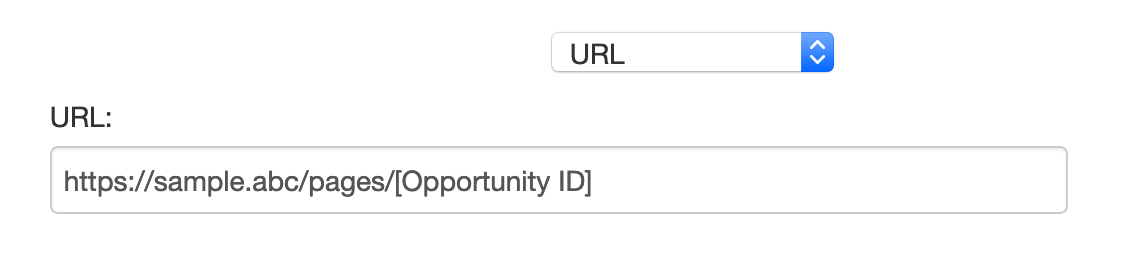
Generally, you'll want to reference one or more fields from your data to create that URL. You'll want to use the same bracket notation used in scripting to reference those fields and build the URL. For example, you might be passing back to a specific page referenced through the Opportunity ID in the URL, you'd have your URL with [Opportunity ID] in it as shown below:

URL Links

How do I tie together reports and dashboards through drillthroughs?

Drillthroughs enable you to connect your reports and dashboards together. Open up the field edit window (click on the field in the report and chooes Edit Field Properties... from the drop down) and click to the Links tab. Click on Create a Link and change the selection to Drillthrough.

Drillthrough Setup

First, choose whether the drillthrough will go to a report or dashboard, and choose the report or dashboard you'll link to. Typically, drillthroughs are used to go from higher level to lower level information. For example, a chart of project summary information might link into the detailed todo information underlying that summary information. In such a scenario, you'd define the drillthrough on the Project Name field in the summary report, and choose a drillthrough table of Todo Table or some other list report containing the detailed information. The drillthrough will automatically create a filter on what you're clicking on, if possible. For example, in our above scenario, clicking on a particular project name will automatically create a filter on Project Name in the target report.

You have several options for customizing drillthrough behavior:

  • Show Filters on End Report - if enabled, the filters created by the drillthrough will be shown on the target.
  • Add All Report Filters - if enabled, all report level filters on the source report will be passed through to the target.
  • Include Groupings in Row - if enabled, all groupings found on the source report element will be passed through to the target. For example, if you can click on a Current Stage value in the list report, but there's also a Sales Rep grouping on the row, the Sales Rep value will be included as well as the Current Stage.
  • Show Drillthrough Window - if enabled, the target will be displayed in a modal window instead of navigating to a separate page.
  • Add Field to Target Report - if enabled, the report element field clicked will be added to the target report if possible.

Configuring Drillthroughs and URL Links at a Data Source Level

You can also configure drillthroughs at the data source level so that you don't have to recreate configuration for each report. For more information, see Data Source Drillthroughs.

Excluding Fields from Drillthroughs

Especially in list reports, you might find that you have certain fields you don't want to include in a drillthrough. For example, in a forecasting report, you might have a variety of date fields, purchase fields, and more, while you really want the drillthrough to only operate off of the SKU in the row:

Drillthrough Setup

To set up drillthrough field exclusions, click on Custom Field -> Manage Report Fields from the report editor:

Drillthrough Setup

Toggle the 'Skip on Drillthrough' toggle at the top of the window, then toggle off the fields you want excluded by default from drillthroughs:

Drillthrough Setup

Add Field to Target Report

You can use this option to easily create more dynamic drillthrough reports. For example, we can start with the following trend report:

Drillthrough Setup

Using the Add Field to Target Report option, we can create a dynamic drillthrough to show month over month history. First, we'll create a column chart using Deal Size as the starting point:

Drillthrough Setup

From there, we can return to our trend report and set up the same drillthrough on all three fields, checking the Add Field to Target Report option:

Drillthrough Setup

Once configured, the column chart automatically updates to the appropriate measure when we click on the trend number:

Clicking on Won Count in the KPI report produces:
Drillthrough Setup
Clicking on Won Deals in the KPI report produces:
Drillthrough Setup

You can use this option in conjunction with the following reports as the drillthrough target:

  • List
  • Column
  • Pie
  • Bar
  • Stacked Column
  • Stacked Bar
  • Crosstab
  • Funnel
  • Area
  • Line
  • Tree Map
  • Sankey

Advanced Drillthroughs

This help document will walk through how to set up drillthroughs into dashboards using one page for line level detail and additional pages for trend analysis specific to the drillthrough.

First, let's take a look at the default template drillthrough dashboards that many of our connections have:

Drillthrough Dashboard

In this case, we're clicking into a dashboard instead of a report. This dashboard starts with the same sort of detail report you'll typically drill into, but also includes three Drillthrough Trend reports which enable you to analyze the 'why' of the underlying data. In this case, we're looking at how the sales by sales representative have changed between the drillthrough date period and the previous same date period.

These drillthrough trend reports will update to reflect the measure you clicked on to start the drillthrough. For example, if you click on Invoiced Total, the drillthrough trend will update to compare Invoiced Total. If you click on Gross Profit, it will update to compare Gross Profit.

You can make your own updates to these drillthrough trend reports. For example, if you want to create a separate trend report of 'Drillthrough Trend by Customer', you can Start by opening up one of the existing reports in the editor:

Editing Drillthrough Report

In this case, we'll replace the SalesRepresentative field with Customer:

Changing Drillthrough Field to Customer

There's one further tweak to make after that. You'll want to do Configuration -> Conditional Formatting and find the line which says something along the lines of:

reportname(fieldchoiceselected("Invoice/CR Line Total") + " Trend by Sales Rep")

This line of scripting updates the report to the name of the measure used, which in this case is being dynamically passed in through the drillthrough. Since it includes 'Sales Rep' in this case, we'll want to update the script to:

reportname(fieldchoiceselected("Invoice/CR Line Total") + " Trend by Customer")

With that done, save a copy of the report. Next, find and edit the drillthrough dashboard in the list reports on your dashboard. It will typically be under the Dashboard Reports folder:

Adding Page to Drillthrough Dashboard

Click on Page Options -> Add Page, then drag the newly created report from the left into the new page:

Adding Report to Dashboard

Save your dashboard and try clicking into the drillthrough from the main dashboard again. You'll see your new section on the drillthrough:

Added Drillthrough Page
Twitter Logo