

We've finished up a new round of template reports to help you really understand costs for Cin7 Core, Omni, and Katana. With these templates, we've made a number of additional general enhancements, so this update will both cover the new templates as well as the new functionality used in these templates.
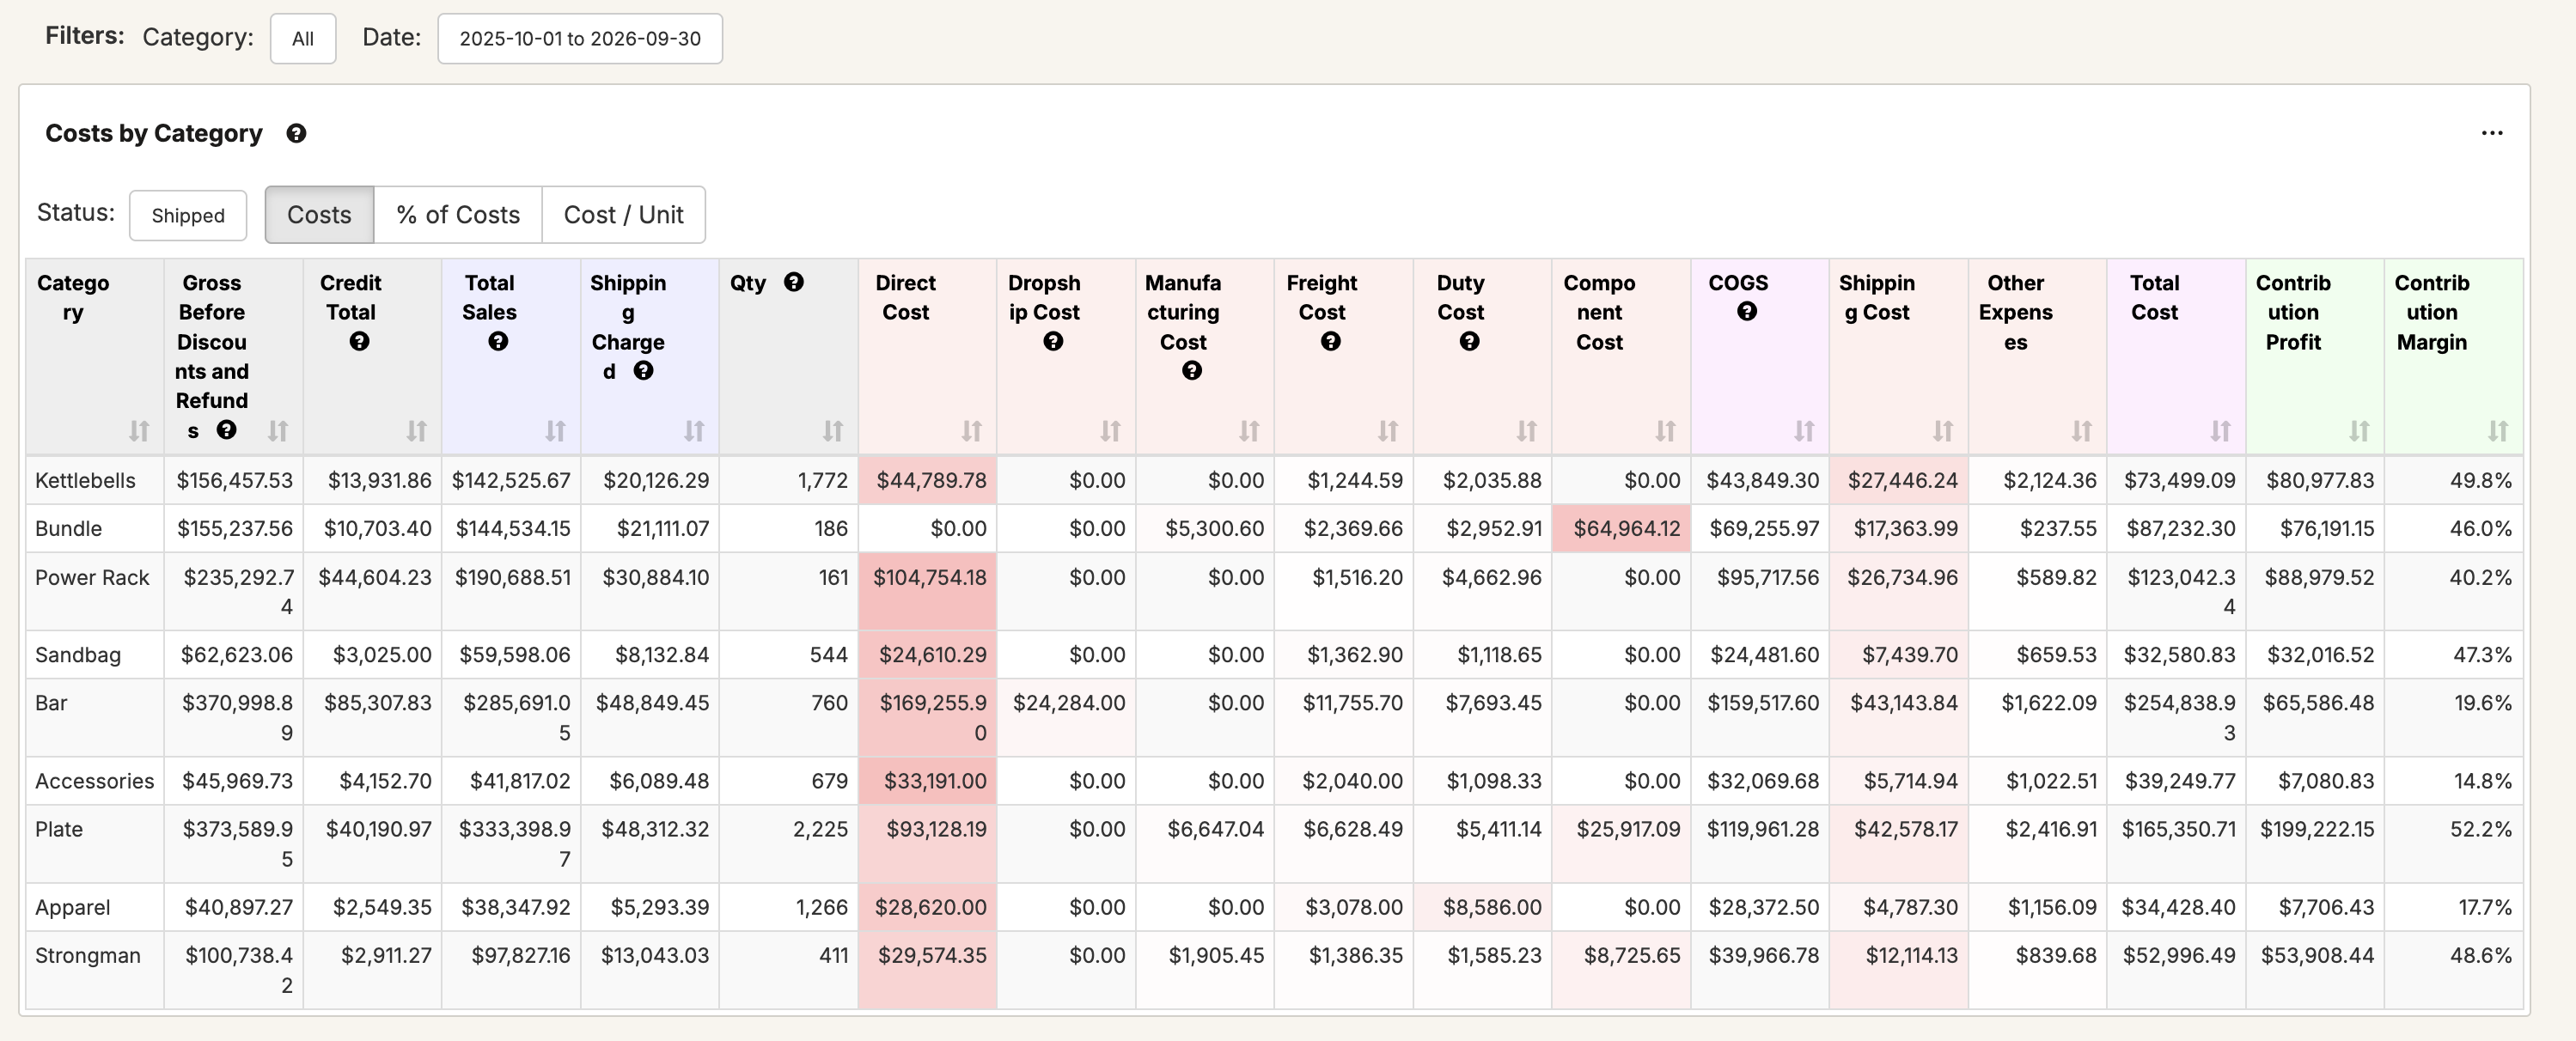
These templates provide the following default views:
Each of these reports contains the following fields:
If COGS Analysis is enabled on your data, you'll also see your COGS broken up into:
If you want to create your own variant on this report, you can simply open one of the reports and edit it. So for example, you could create a copy that looks at costs and profits by brand, by sales rep, by source channel, or by anything else.
For this report, you can toggle between Costs, % of Costs, and Cost / Unit:

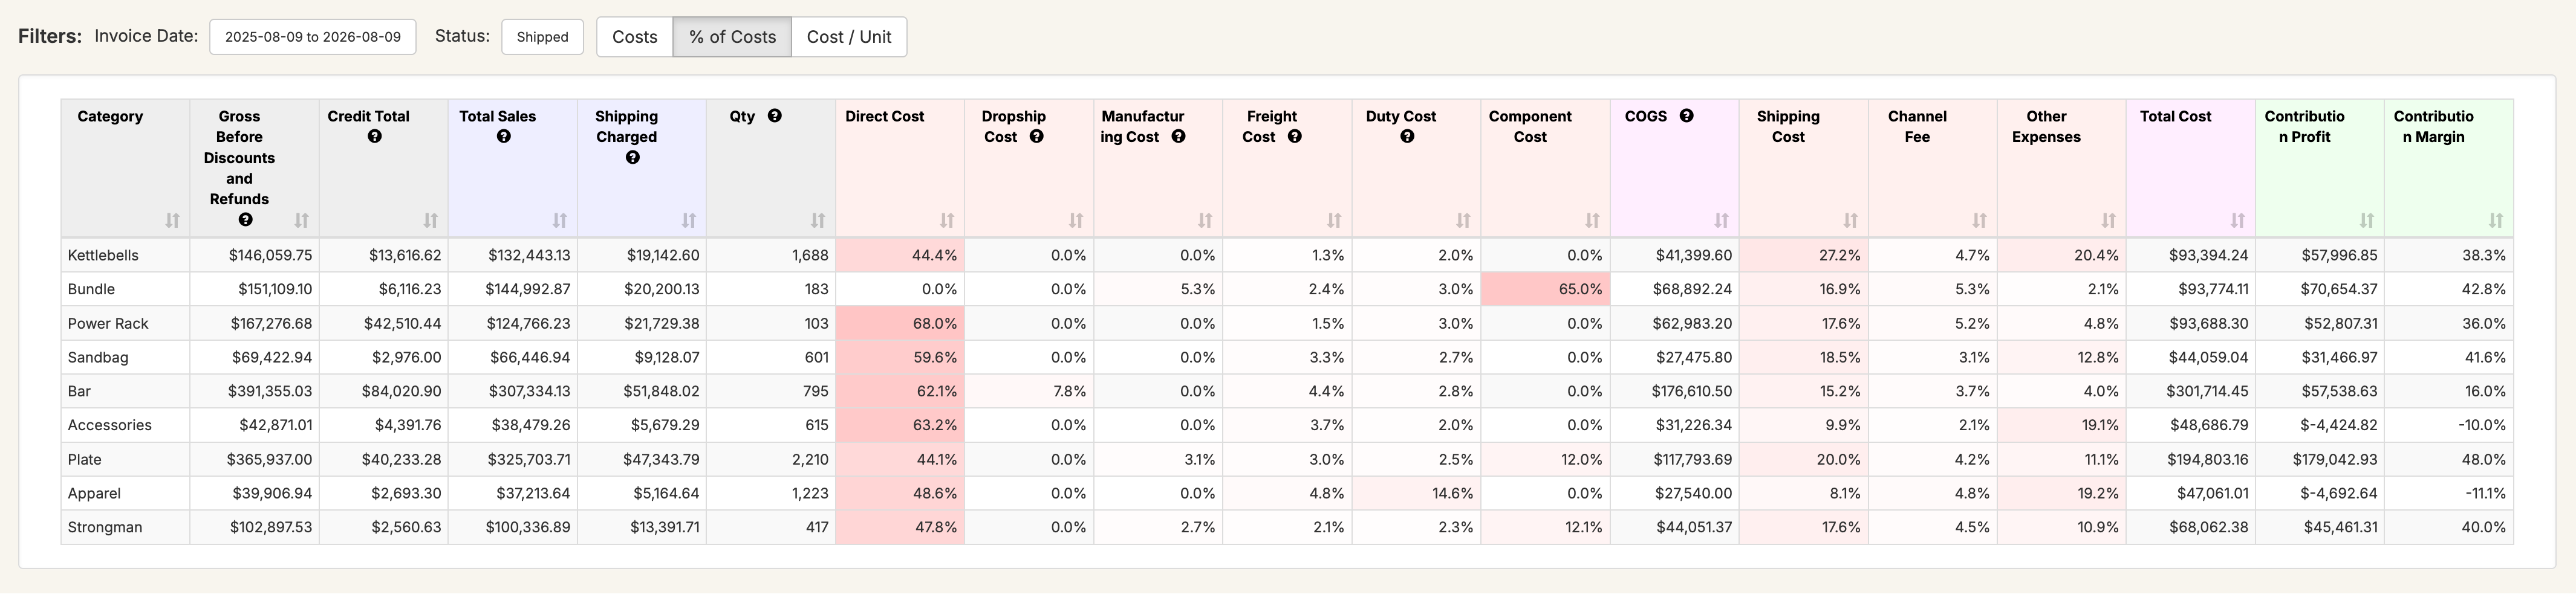
Costs shows the default values, while % of Costs shows the % of each value across the row:
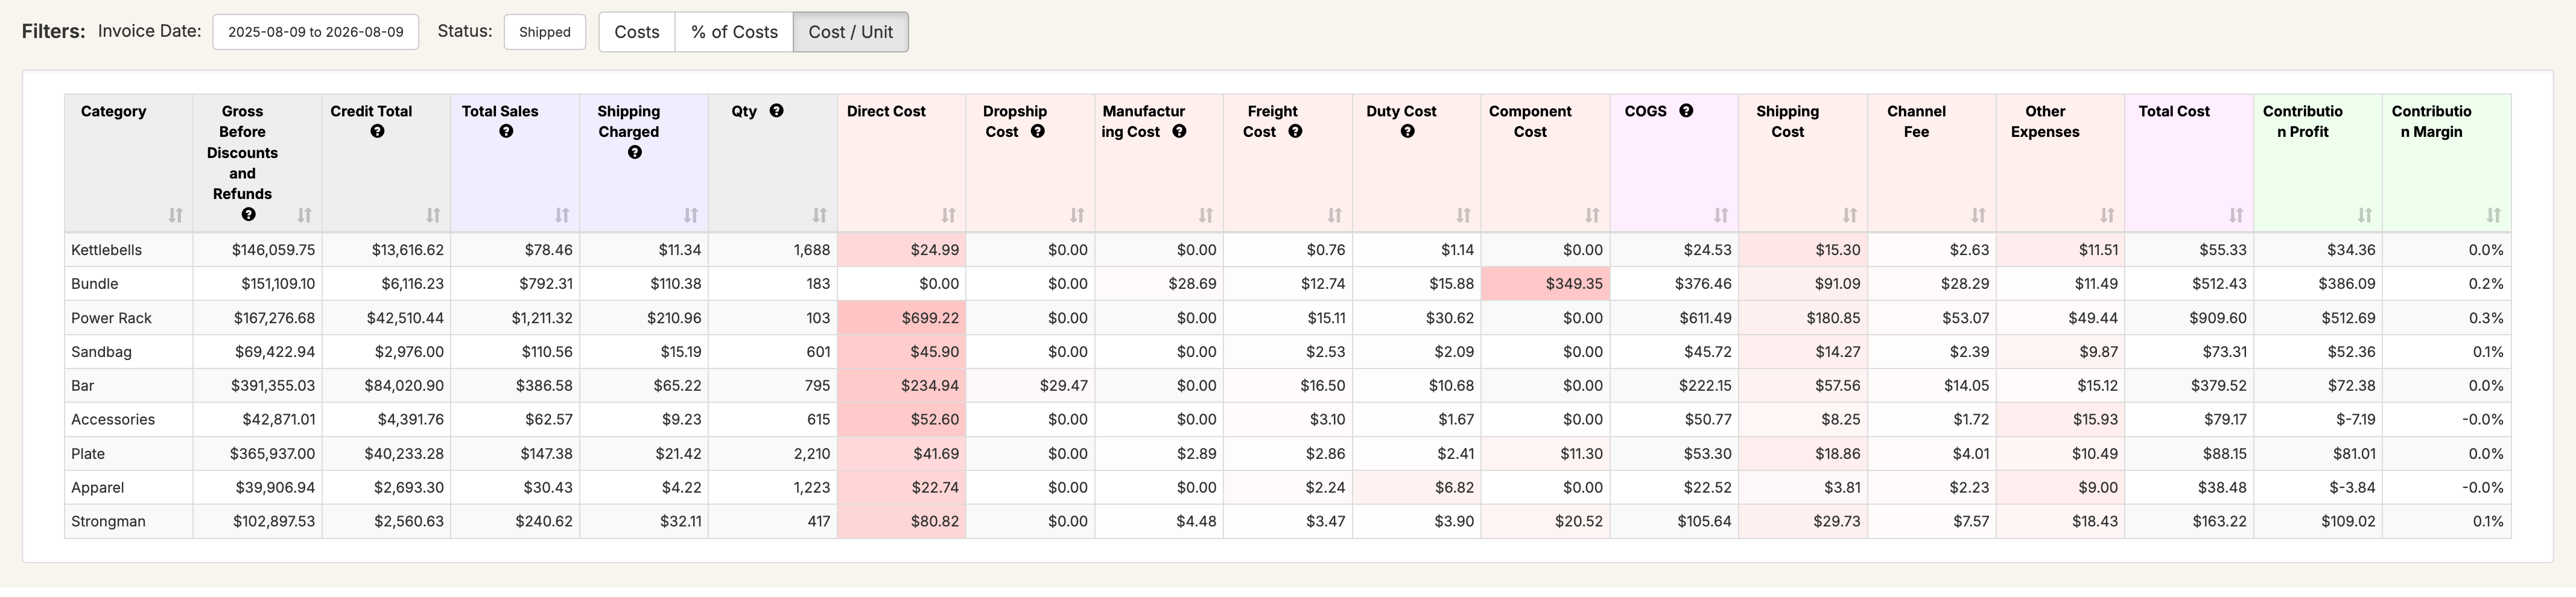
Cost / Unit shows the cost per quantity. By default, this will be the order quantity, but you can also customize it to be a base unit, so if you sell beverages, you look at cost per can or bottle:
For more information on the enhancements we've made to support this functionality so that you can add them to your own reports as well, see Script Filters.
With the sheer number of columns in these reports, you can also now set lists reports to suppress any columns where all values are zero. So in the example of these reports, if you haven't set up channel fees to come in, the channel fee column won't be shown. You can configure this through Configuration -> Report Properties -> Formatting -> Hide Zero Measure Columns.
This report also highlights cost cells based on their value, so that if direct cost is the highest cost for the row, those cells will show in more of a shade of red to help them visually pop. You can configure this through Configuration -> Conditional Formatting with the example in this case of:
percentofrowcolor("Cost", "#FFFFFF", "#FFAAAA")This scripting function calculates background colors for all values on the row where the field segment is the first parameter, then determines the color between the two other parameters. In this case, #FFFFFF is white and FFAAAA is bright red, so it will find the color between white and red.
We've also extended the use of segments to help with changing header colors. If you go to Configuration -> Additional Scripting on these reports, you'll see:
segmentheaderbackgroundcolor("Cost", "#FFF0EE", "#000000")
segmentheaderbackgroundcolor("Sales", "#EEEEEE", "#000000")
segmentheaderbackgroundcolor("TotalCost", "#FEE0F0", "#000000")
segmentheaderbackgroundcolor("Revenue", "#EEEEFF", "#000000")
segmentheaderbackgroundcolor("Profit", "#EEFFEE", "#000000")
segmentheaderbackgroundcolor("OtherCost", "#FFEEFF", "#000000")
Each of these script function calls of segmentheaderbackgroundcolor finds all fields with the specified segment and set the background color/text color to the specified 2nd and 3rd parameters.
For these reports, we also wanted the drillthrough to go to a specific drillthrough without having to configure it per field. To do this, we've added an option of 'Field Rule Category' found under Configuration -> Report Properties -> Report Processing:

Under the data source drillthroughs, we've added the option of 'for any report with a category set to', so in this case, we've specified that any report with a category set to Costs will use the Cost by Sales Order Drillthrough report as its drillthrough target:
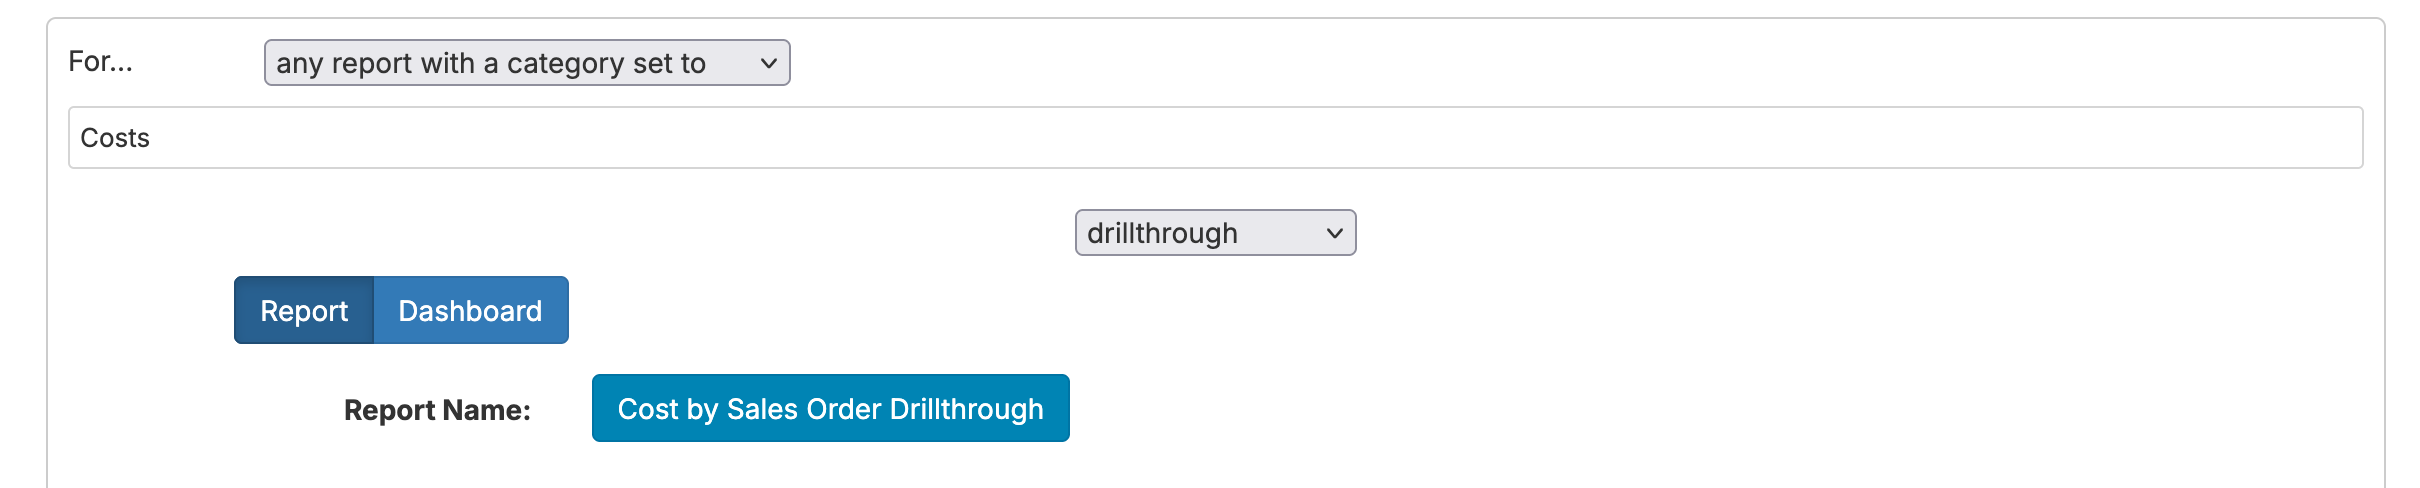
You could use the same option to customize your own drillthroughs without having to go through and set up a large number of drillthroughs per field on your reports.