We have a variety of smaller improvements to kick off April.
We've added inventory levels to the Katana connection! Add reporting around quantity in stock, quantity missing, reorder levels, and more.
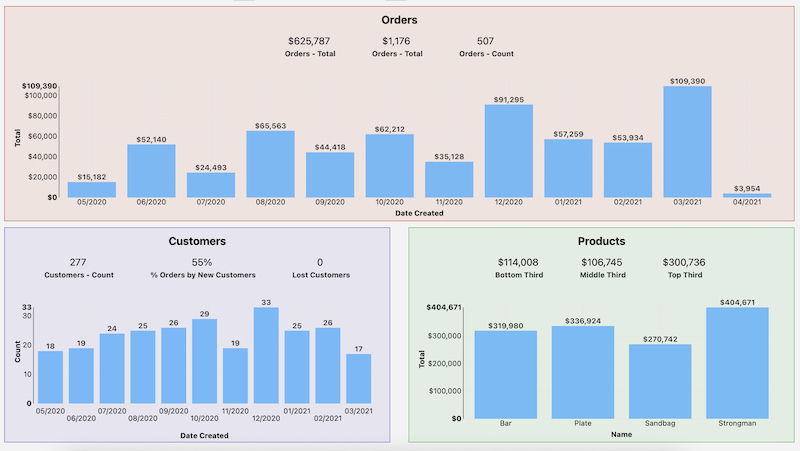
You can now customize the style of a particular section of a dashboard, not just a single report:
When you drag a report into a dashboard, any large list reports in your dashboard will automatically collapse down to a smaller size while you drag so that you can easily drag the report anywhere into the dashboard.
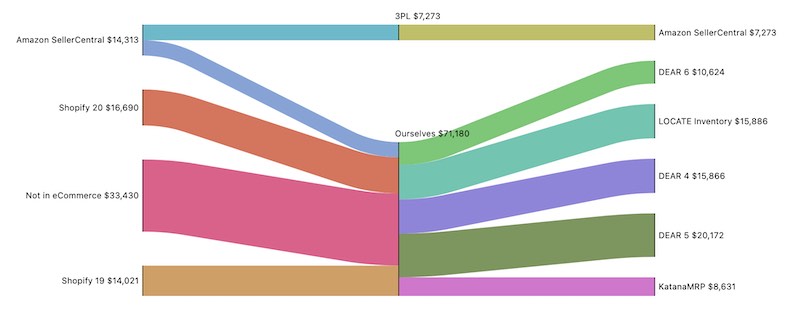
You can now use Sankey diagrams in Easy Insight! Sankey diagrams help you to see the relative flow of a value as it goes across multiple systems or stages. For example, you can look at your order volume going through multiple storefront services, break it out by 3PL and your own fulfillment systems, and look at the amount fulfilled by each end system as in the example below: