For this week, we've got improvements to diagrams, new functionality for date range filters, and new ways to style table cells in reports.
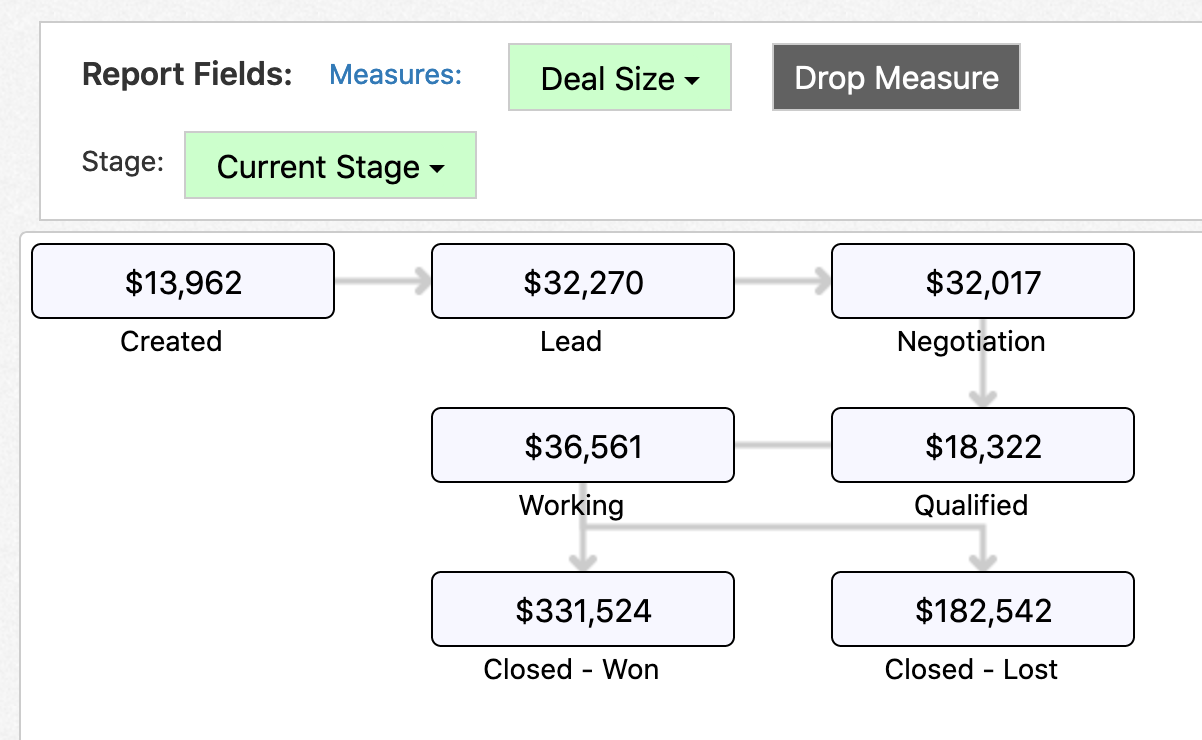
You can now auto generate diagram reports instead of having to manually set up each step, helping you to easily create flow diagrams like the following:
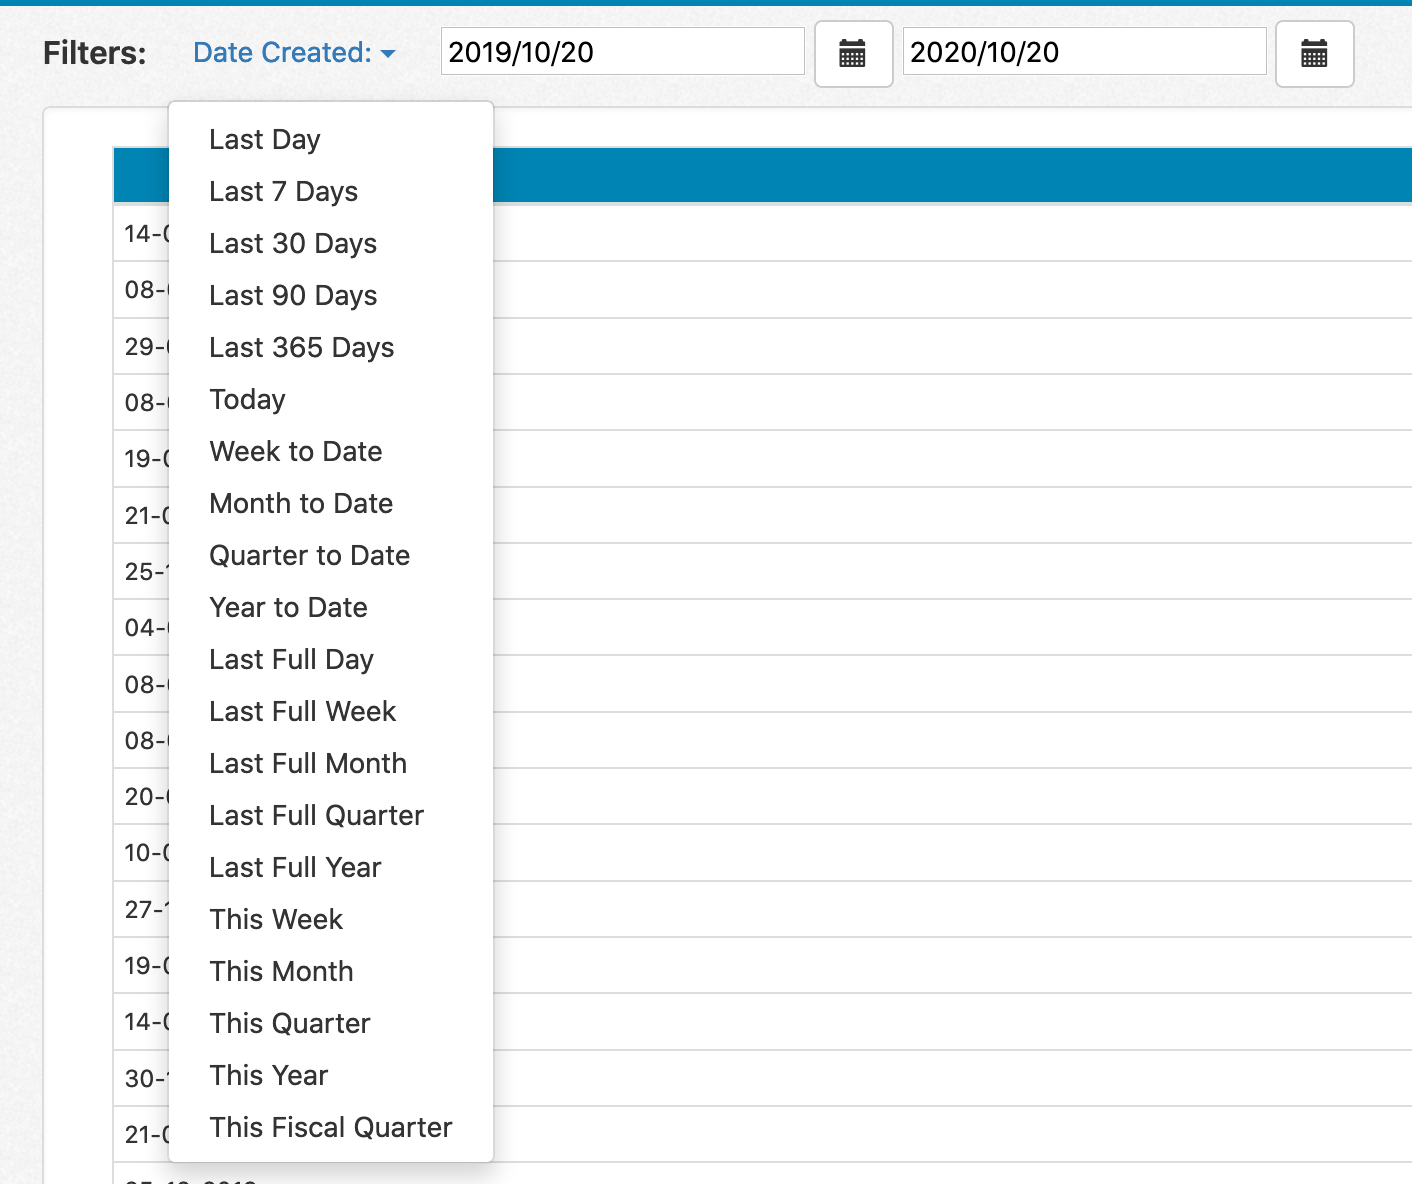
Want to quickly change an absolute date range filter to a certain time range? You can now click on the filter label to quickly change your date filter to one of the standard rolling date ranges:
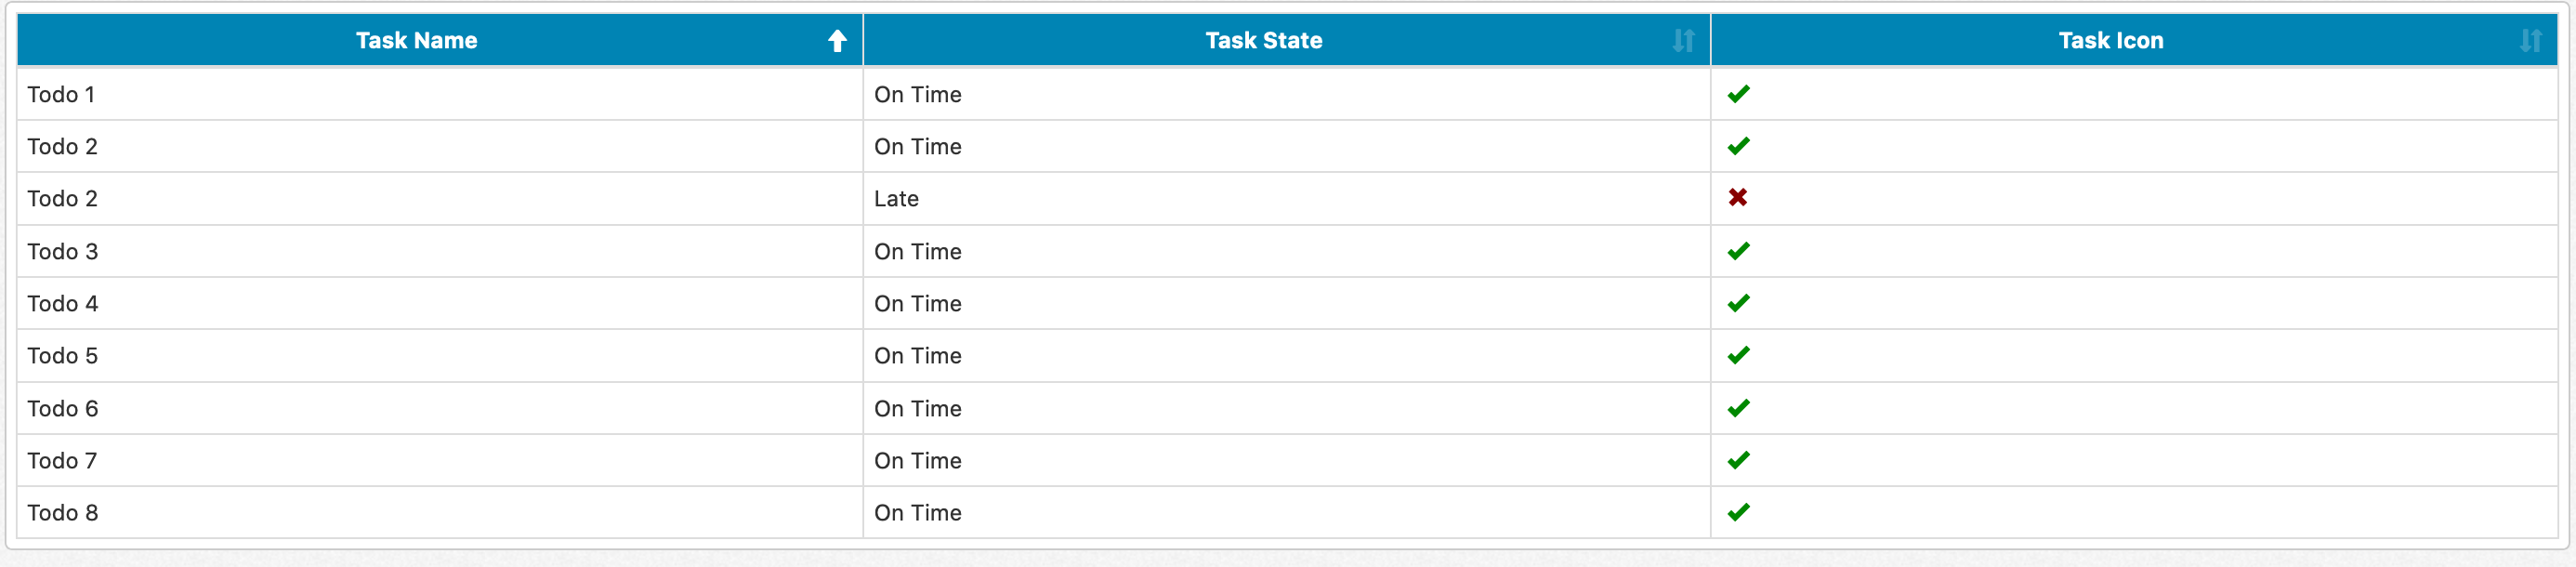
We've added a couple of new options to use in styling table cells in list, tree, summary, and form reports. You can use conditional formatting to style table cells as icons:
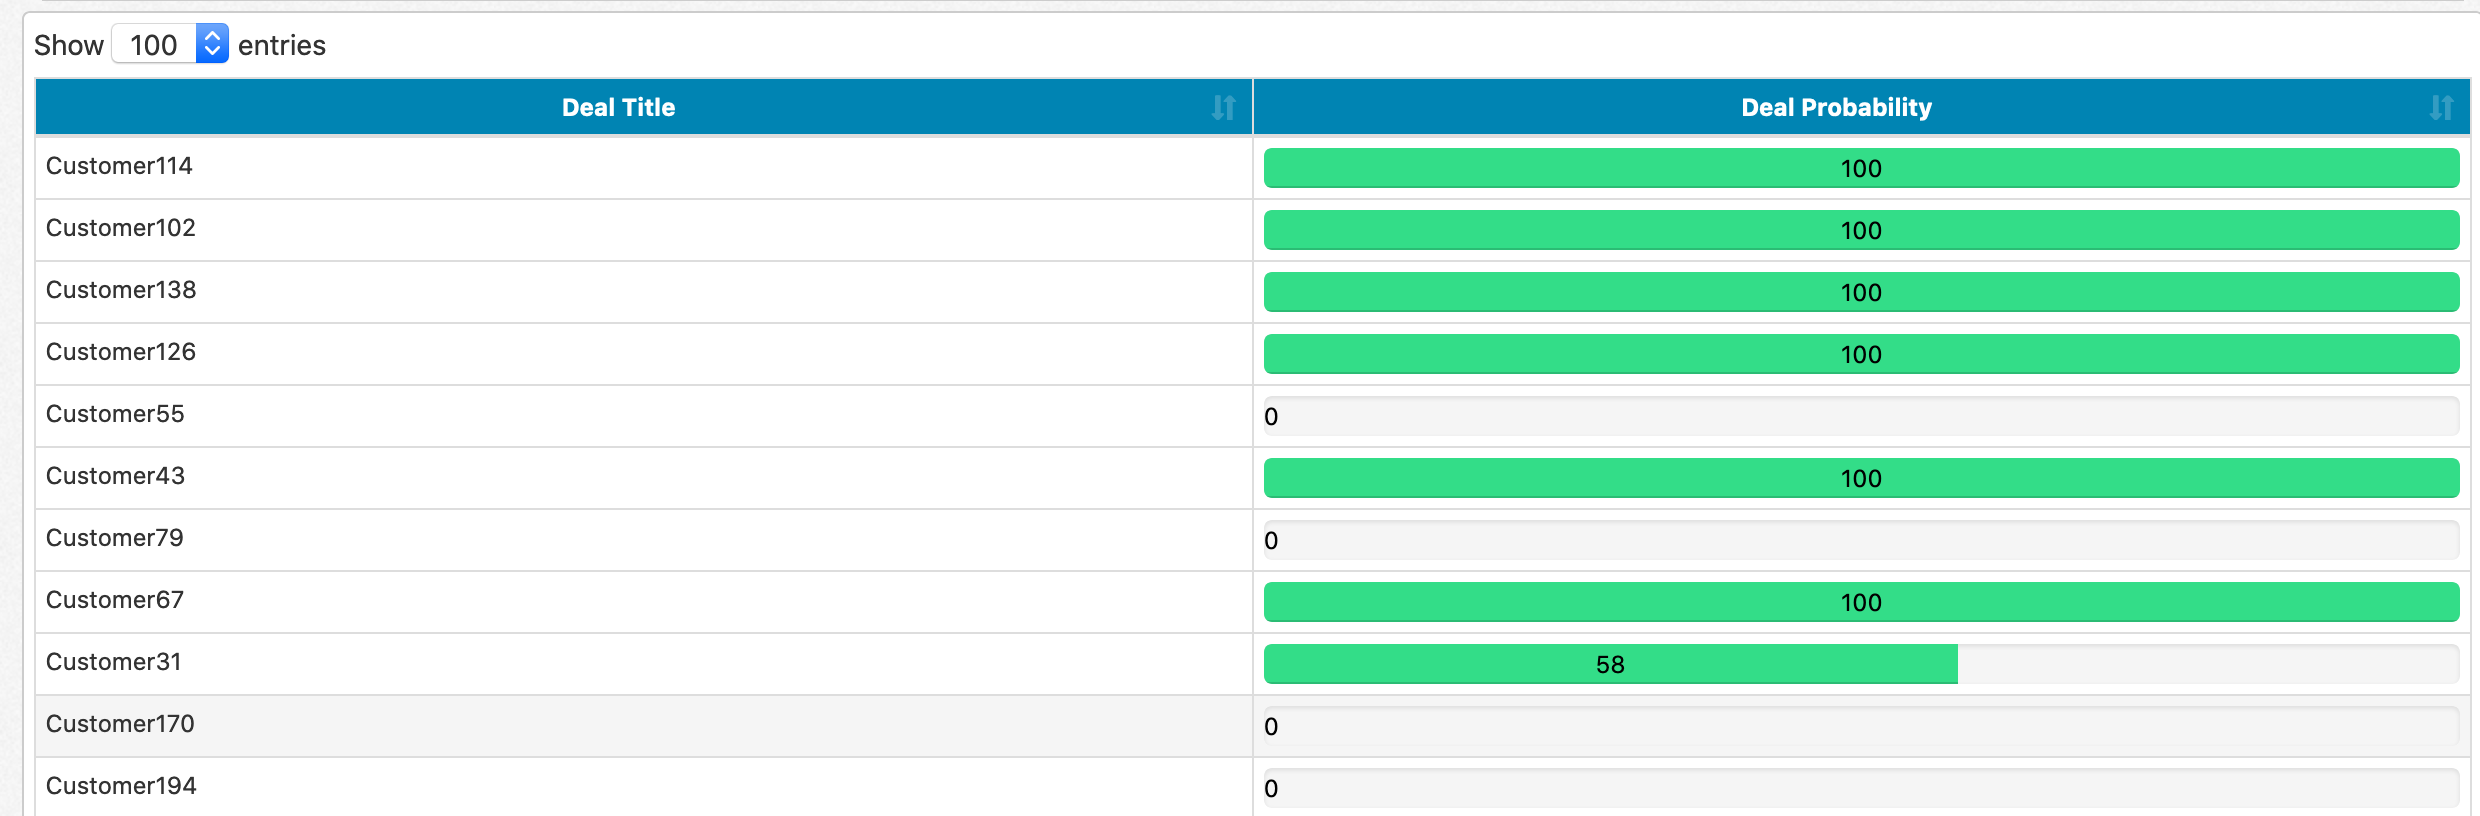
You can also display values as progress bars: