We've added tree maps as a new report type, improved Trello configuration, added the ability to display your dashboards on a TV platform, and started adding field documentation for data sources.
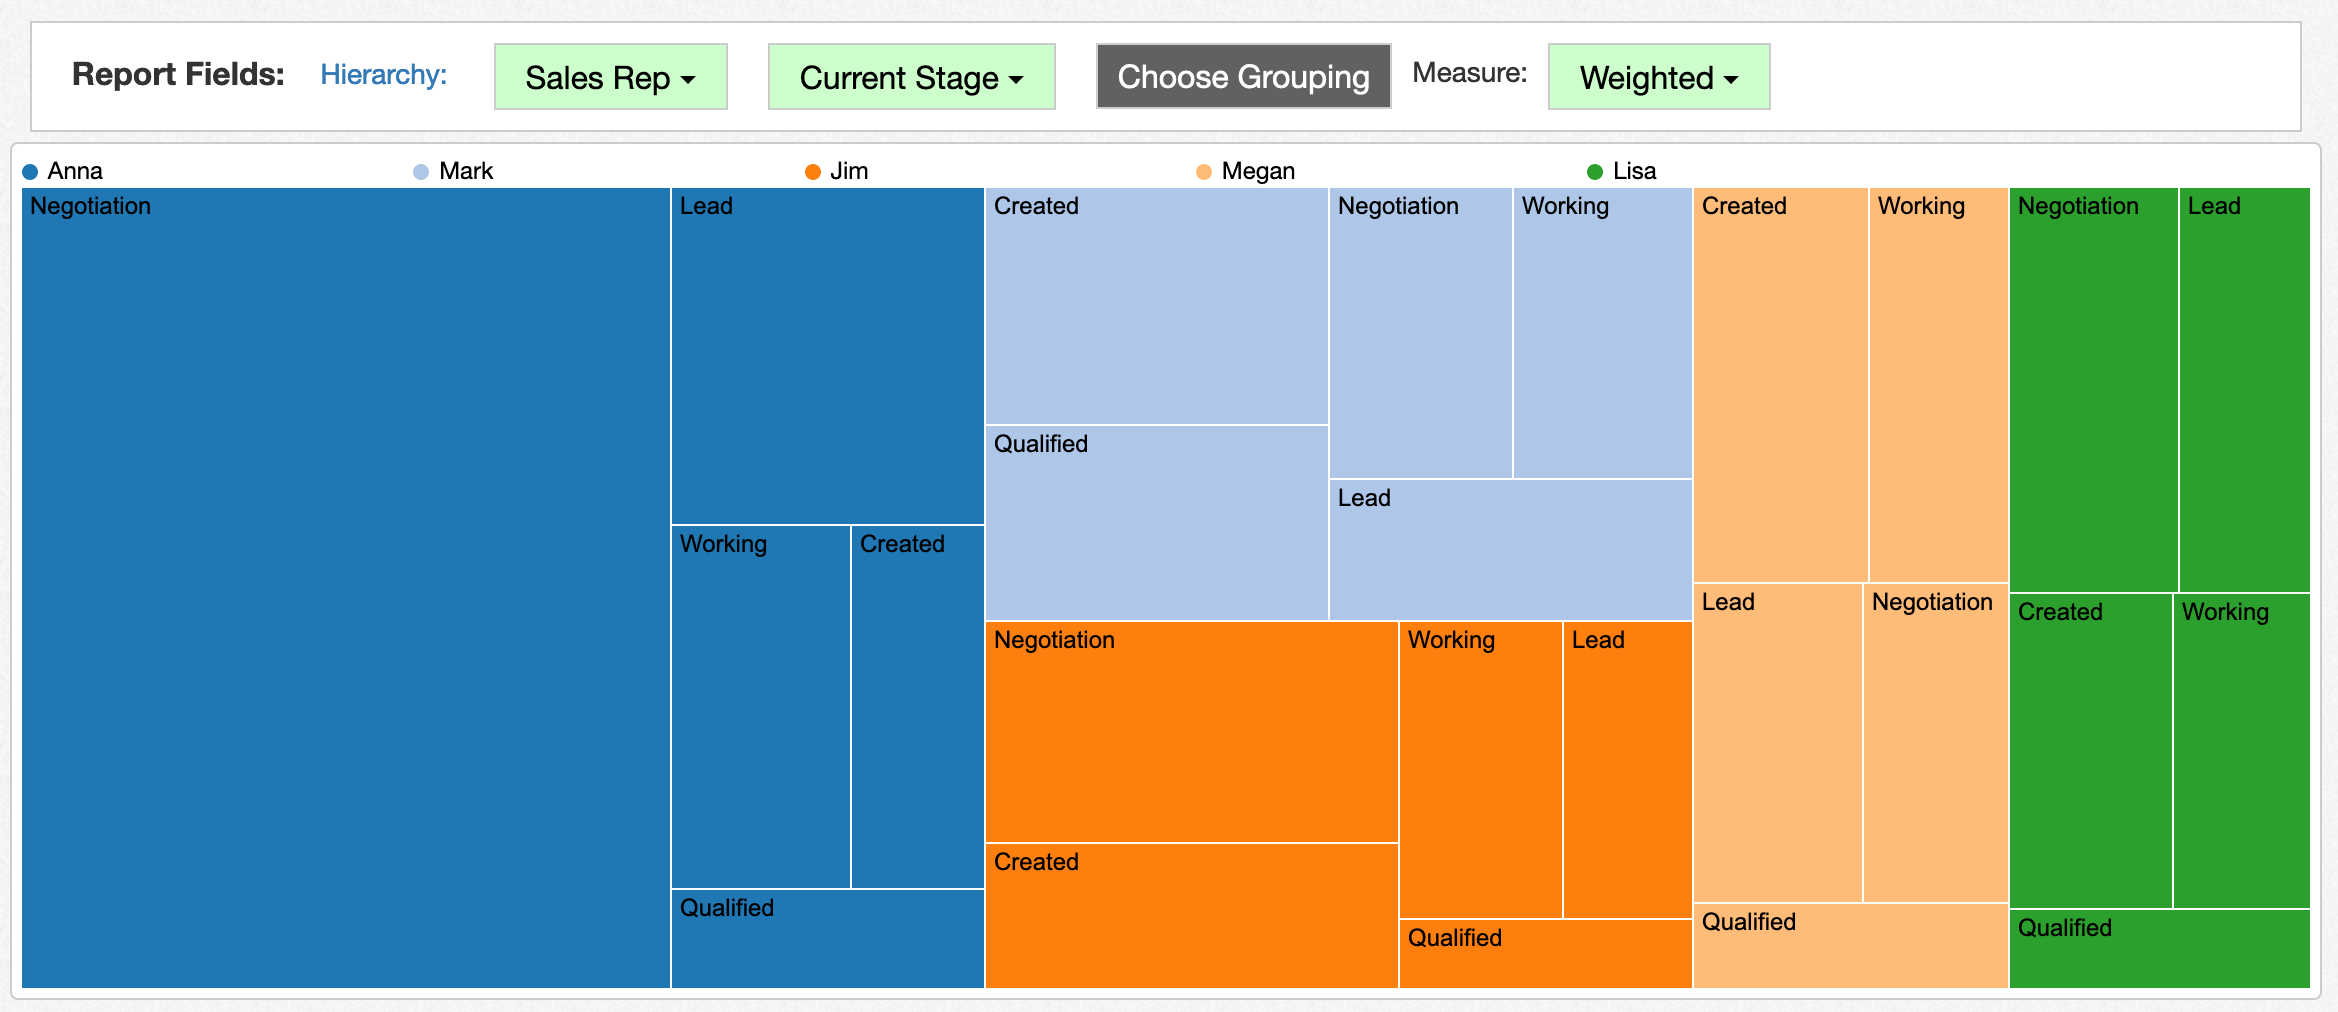
You can now render your reports as tree maps! Choose Tree Map from the report type selector. You'll need to specify two groupings and a measure:
Tree maps make it easy to see which particular combinations stand out in your data. For example, in this chart, you can easily see that Anna has the largest pipeline, with the highest concentration of deals in the Negotiation stage:
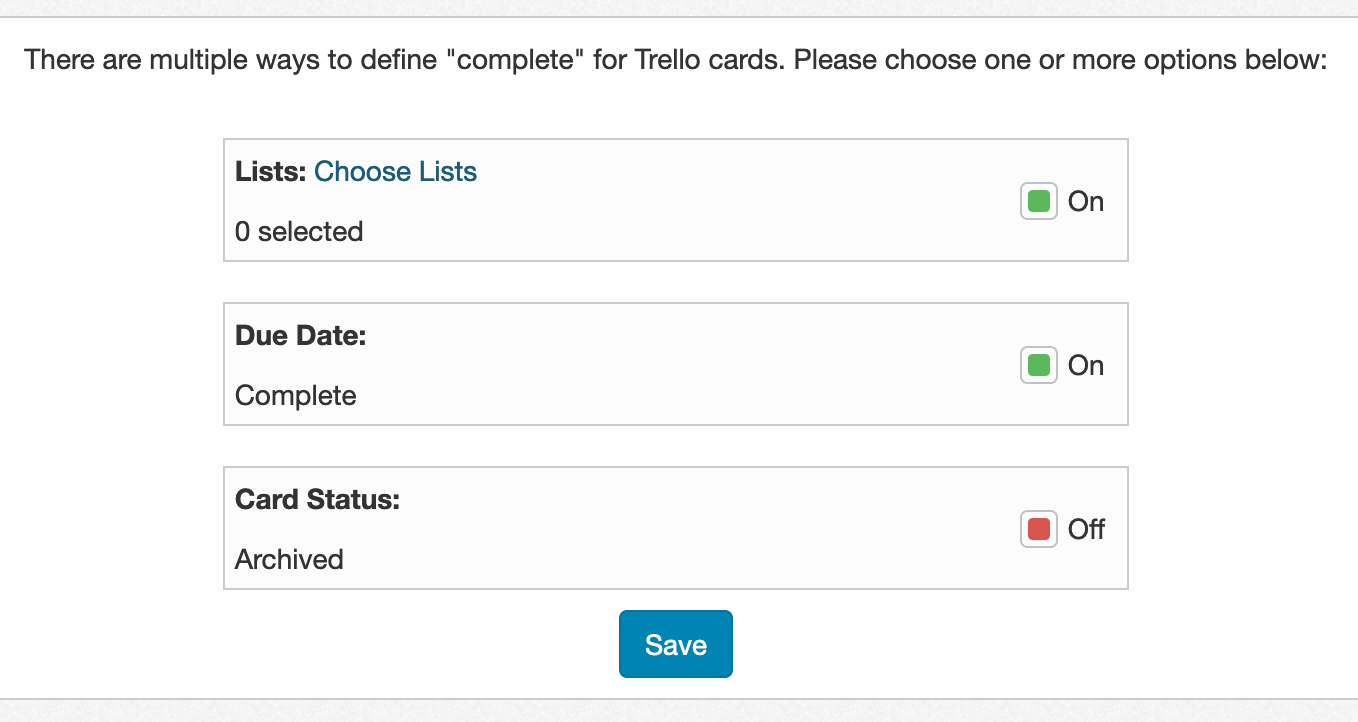
Since Trello provides numerous ways to mark a card as complete, we've updated Easy Insight to support these different approaches. When you create a new connection to Trello, you'll be directed to a screen that guides you through its setup:
If you need to make further changes, you can access this same screen from the Trello data source page by clicking on 'Configure Card Completion' and making the necessary changes.
If you want to put an Easy Insight dashboard on a TV screen in your office, you can now set up the dashboard to automatically page through different sections and to automatically refresh the data.
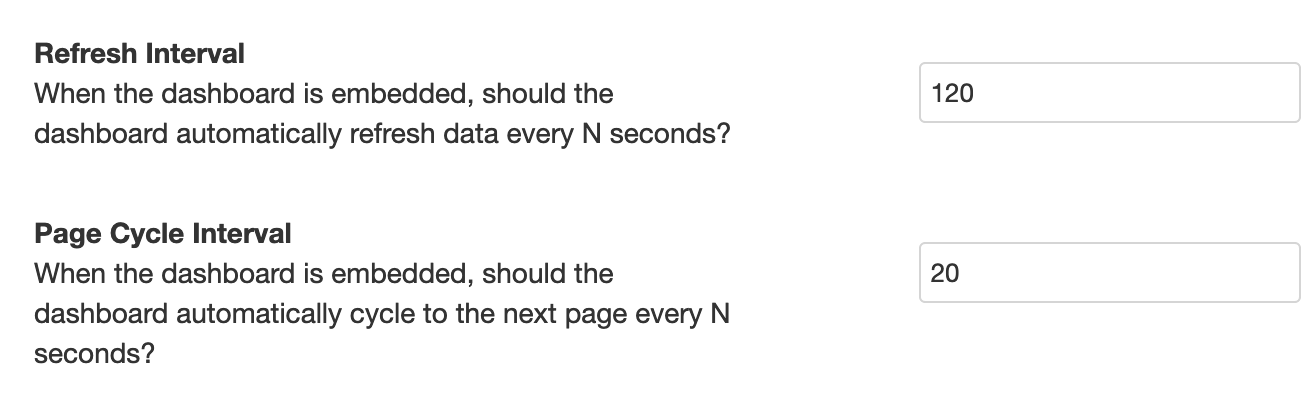
Edit the dashboard, click on Configuration -> Dashboard Properties, and go to the Embed section. You'll see two new properties at the bottom of the window, Refresh Interval and Page Cycle Interval:
Refresh Interval defines how often the dashboard will refresh the reports in seconds. Page Cycle Interval defines how often the dashboard will cycle to the next page in seconds.
After setting up those values, you'll want to put the embedded version of the dashboard onto the screen. Use the normal dashboard URL with /embed at the end of the URL. For example, if your dashboard URL is https://www.easy-insight.com/a/dashboard/abc, you would use https://www.easy-insight.com/a/dashboard/abc/embed as the embed URL.
Finally, we've started to add field documentation for the different data sources to help you understand what the exact meaning of a field is. We've started with
Teamwork Projects and
Trello, with many more coming soon.
These field documentation pages should help you to quickly understand just what a particular field in your data source does and make it easier to create the reports you need.