We've added new connections to BigCommerce, NewEgg, and Unleashed Inventory. We've added the option to leave notes with your report and dashboard saves. We've also made numerous enhancements to other connections.
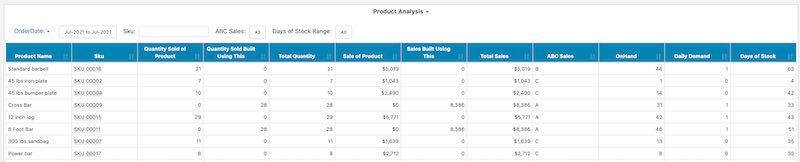
For DEAR, LOCATE, Cin7, and Unleashed, we've added the option to report not just on what your current inventory quantities and projected needs are, but what's required based on products used in assembly. For example, 60% of your sold products might all use a container product as part of their build. Our prebuilt dashboards for these systems have been updated to offer reports that include analysis of needed quantities based on build materials:
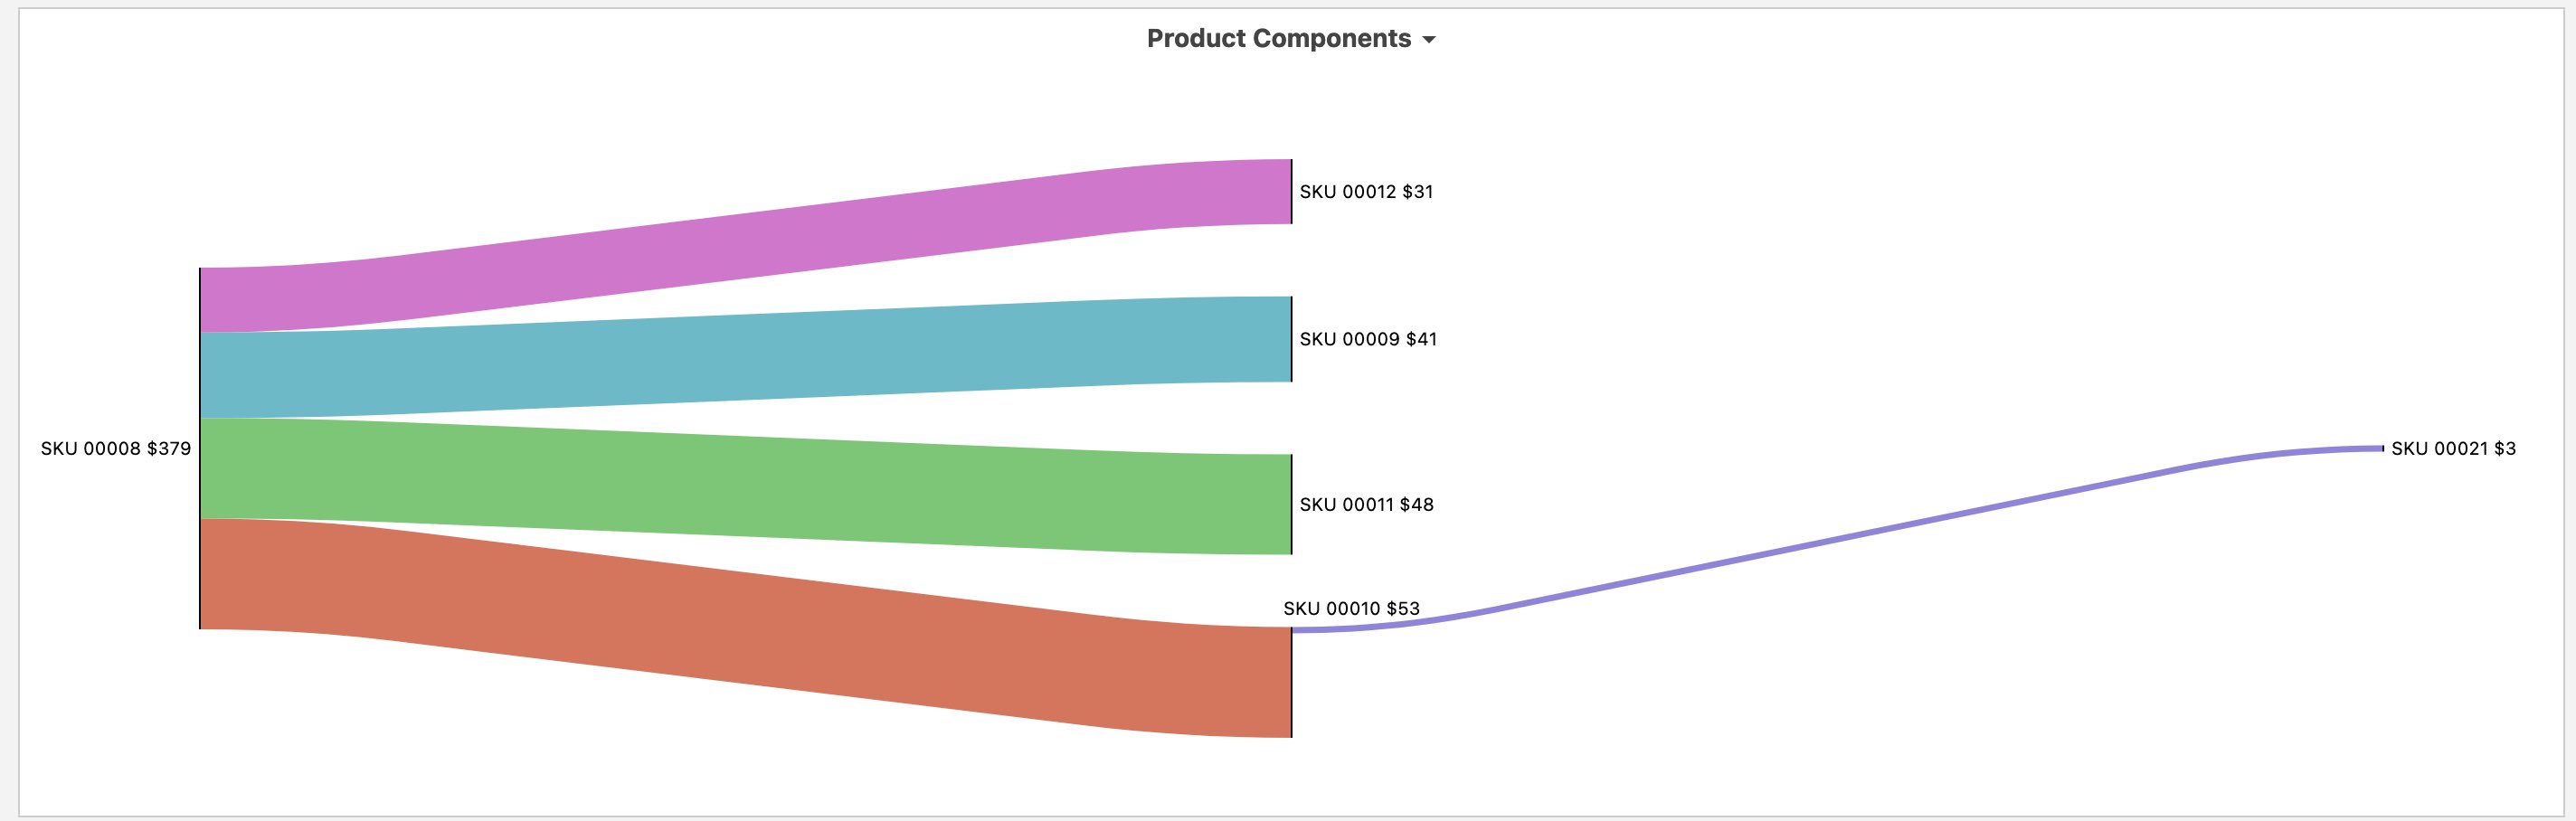
You can even click into details and see exactly how a component is used across the rest of your manufacturing:
We've added new connections to BigCommerce, NewEgg, and Unleashed Inventory. You can track your e-commerce performance in both BigCommerce and NewEgg. Use Unleashed for your inventory data? You can create reports here as well.
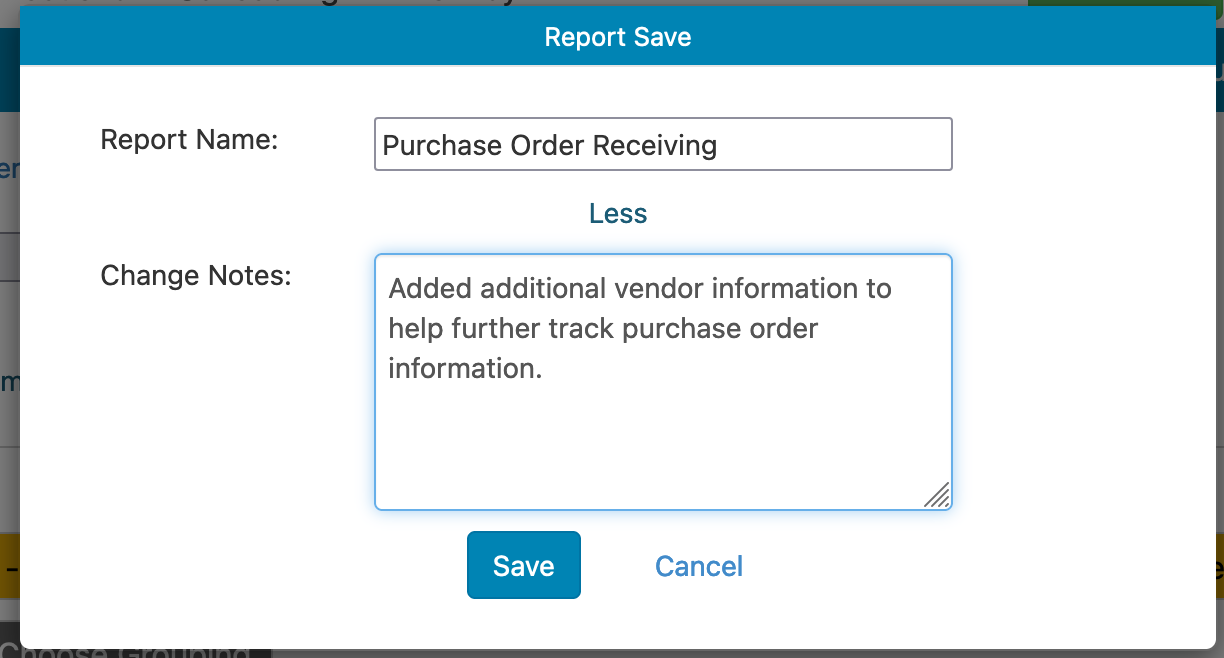
When saving a report or dashboard, you can now leave change notes:
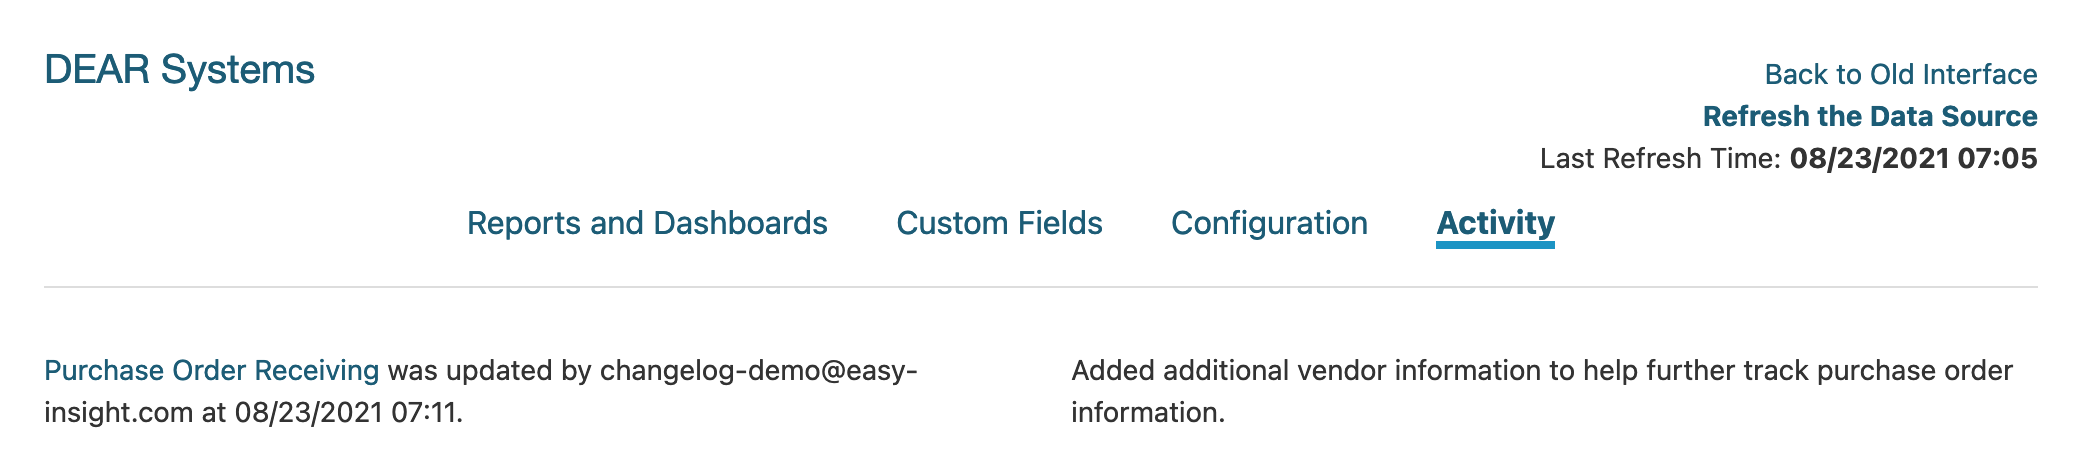
We've also added an 'Activity' view to the data source (only available if you've switched to the new interface). The Activity view shows all edits made to reports or dashboards on the data source, including their change notes:
You can also view change notes under Version History for reports and dashboards to help see what someone may have changed or just remind yourself of what you did a few months prior.
We've added a large number of additional fields to our LOCATE integration. You can now pull over scrapped inventory, returns, inventory available for sale, dropship information, and much, much more.
We've added classes to the QuickBooks Online connection, including class information at both the order and line level.
With our inventory reporting, we've added the ABC function for inventory analysis. ABC analysis is a Pareto principal-based approach for classifying inventory items based on the consumption values of the items, aiming to identify the items with the top 80% contribution to your business. The ABC function in Easy Insight uses the following format:
abc([Field Name], .8, .95, 1)
For this script, you'd want to use a custom grouping. Field Name is the metric you're using to group the data (for example, Sales Quantity). The three numbers are what define the A, B, and C classifications. In this case, the .8 is defining the top 80% as A, the .95 is defining the next 15% as B, and the 1 is defining the remaining 5% as C.
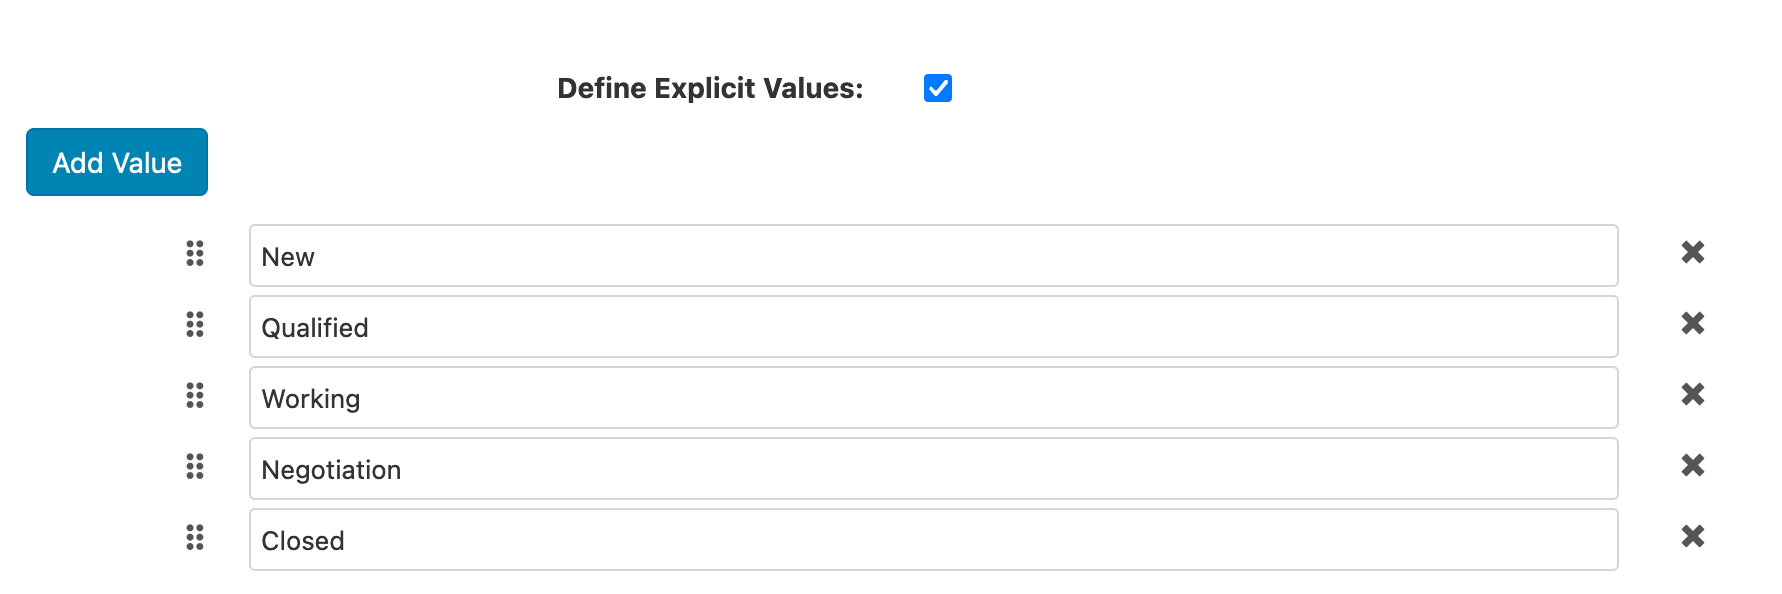
You can now explicitly define single and multi filter values as part of the filter creation, rather than relying on the values pulled back from the data. For example, you might have a Stage field with possible values of New, Qualified, Working, Negotiation, and Closed, but at any given point, your pipeline data might not have one of those values. If you want the filter to always show all possible values, you can explicitly define those values by editing the filter and toggling 'Define Explicit Values':
Set up your values and save, and the filter will automatically show only those values. This setting can also be useful on custom groupings like the above ABC analysis where it's difficult for the filter to pull back the list of possible values.